March 21, 2026
FEAR NOT Brave Investors
Where have we been and where are we going? Join our weekly market thread on Traders Community…

Market Dynamics and Instability
The Week That Was – What Lies Ahead?
Fear and Greed Feed Volatility
Contents
Click on the links below to navigate to the relevant section.
- Part A: Stock markets
- Part B: Bonds
- Fed and Banks
- Part C: Commodities
- Energy – Oil and Gas
- Gold and Silver
- Part D: Foreign Exchange
- Geopolitics and Economics
- Economy Week ahead
Editorial
Safe havens and crowded trades don’t go together when the bids run out, classic herd mentality exposed again this week with gold and silver. Gold having its biggest weekly loss since 1983. Gold futures settled $30.80 lower Friday (-0.7%) at $4,574.90/oz, down about -9.6% on the week. A stronger U.S. dollar and rising Treasury yields, driven by elevated inflation concerns and a “higher-for-longer” Fed outlook, continued to pressure precious metal prices. Friday saw no place to hide with no safe havens. Key “insurance” (Credit default swaps) markets lurching toward dislocation.

Global bonds are under further heavy selling pressure. Treasuries, MBS, agencies, corporates, and Muni bonds all hammered, this following slides in Europe and Asian bonds. Stocks and precious metals both wrecked. Spreads blowing out with CDS prices spiking higher. Emerging markets whacked as currency instability shakes across the board.

Safe haven flows also went to the dollar and despite ongoing geopolitical tensions with the Iran War and the Ukraine war investor outflows and a shift toward cash and dollar assets have outweighed safe-haven gold demand, leaving gold sharply lower on the week. This was off a classic corrective B or 2 wave meaning the bulls were fully sated. Then comes the fall as raising cash combining with higher yields fueling a US dollar rise added to the pressure, when so many are one way and the ‘gold bugs’ are all running to the exit corridor is tight. No matter how many times these crowded trades, think crypto, shares whatever the cultists and their herders always say this time it’s different.

Gold may well reverse much higher, the point is these drawdowns are huge, we use charts for a reason at TC, to keep you discipline and away from hope and glory. Yes, it is because of the war, but we were already falling, doesn’t take much when everyone is the one way.
The Ides of March certainly brought he pain for highly levered global markets, the war just another shot as the AI bubble, private credit lockdown and silver bubble pop already all have their hands up. Volatility is back.
We have sharply lower stock prices coming off many markets all-time highs just days before the US and Israel bombings of Iran. With that widening spreads/risk premiums, rising Treasury/sovereign yields, CDS and currency volatility. Prior to the war inflationary pressures had popped, the RBA raising rates last meeting. War will only stoke it, as we have seen with oil, European natural gas prices and freight rates. Monster fiscal deficits with higher rates adding to the pressures.

Iran has continued with their retaliation to other Gulf States; a quick take is that is a mistake pushing them into the US ambit. Their strategy is pretty clear going back to the last Iran crisis in the 70’s with the plan to topple the US government. Yields moved steadily higher during the week on the inflationary implications of rising energy prices.
Understanding Markets and your Psychological Influences is Critical
We try to always remind it is the financial impact, even more so in futures and options that run markets, more than fundamentals in crowded markets. A reminder they tend to get crowded at tops and bottoms, go check on sheep exiting a pen all once for illustration. This why rising volatility triggers long or short‑only VaR limits, forcing sales or covering of the most liquid, highest‑quality large-cap names and pushing the index down from above. Gold, silver and oil have all reinforced this of the past week?
Beware of anyone spewing advice who is not an experienced trader in the markets they claim knowledge, and charge advice for! No skin in the game? Hit block!
Despite what cultists and fundamentalists spout at the end of day financial structure moves markets, the rubber always meets the road. What begets higher prices is higher prices, what begets lower prices is lower prices. The madness of crowds always kicks in as such until the rubber meets the road and on we go, on and on.
The algos run the game and why its key to have a plan that involves a structured, but flexible blend of fundamentals, market psychology and technical analysis. A plan that visualizes scenarios enabling rapid action and is high probability favored by the algos running things, especially at turning points. When we look at how the stock market started February it was all very hectic. When we look at commodities, the theme continues in particular metals and crypto the manic behavior is front and center.
The Week Gone By:
We had at least 5 significant events in the past week:
- The US and Israel attack Iran; a deepening War Risk is being taken seriously by some at least. War will stoke inflationary pressures and is certain to increase already monster fiscal deficits.
- Market stress is building at the fastest pace since last year’s tariff shock with the Unbelievable Monetary Disorder showing the consequences of extraordinarily loose financial conditions. The pattern continues as de-risking and deleveraging intensified. “Risk parity,” “basis trades,” “carry trades”, and the myriad levered strategies experienced mounting losses.
- Central banks putting sovereign yields under upward pressure with the added driver being hawkish ECB sentiment and a broader repricing of the global central bank space. After post-meeting headlines indicated yesterday that the ECB would consider an April hike, this morning’s comments from ECB officials are mixed with Bundesbank President and Governing Council member Nagel indicating a bias toward hiking as soon as the April meeting while the rest of his colleagues are a little more cautious and circumspect but not rejecting the option. Markets are about 70% priced for an April ECB hike with about 75bps of hikes priced through to year-end. We have the RBA already hiking twice which started before the shock but got a boost from it. The BoE is sounding like it’s teeing up a nearer-term hiking bias. The FOMC is signaling restrictive policy for a while yet.
- Deja Vu with the popular levered European bond trade is blowing up. Yields on gilts are continuing to lead the way higher after the BoE’s hawkish messaging Thursday; 2s are up 12bps and the curve is mildly bear flattening with OIS pricing about 70% odds of an April hike and about 75bps of hikes by year-end which is a full 125bps turnaround from the end of February. The next day ten-year UK Gilt yields surged 15 bps, trading above 5.0% for the first time since 2008. Gilt yields have spiked 76 bps since the start of the war. Italian yields jumped 19 bps Friday (up 69bps in three weeks) to 3.96%, near the high back to December 2023. Greek yields rose 17 bps Friday to 3.93% (up 68 bps in three weeks), the high back to November 2023. US 2s are up 8bps. EGBs are broadly cheaper. Thursday Antipodean 2s were clobbered with Australia up 17bps and NZ up 13. South Korea’s 2s were up 10bps. Bond losses continued Australian 10-year yields rose 13 bps Friday to a 15-year high 5.02%, with New Zealand yields up 14 bps to 4.72%, near a more than two-year high.
- The ever-expanding casino: roughly $5.7 trillion in notional options tied to individual US stocks, indexes and exchange-traded funds expired on Friday in quarterly the ‘triple-witching’. This was the largest March expiry in Citigroup Inc. data going back to 1996. That figure includes $4.1 trillion in index contracts, $772 billion in exchange-traded funds and $875 billion in single-stock options.
Market Fare:
Sectors highlighted internal rotation bias.
- No surprise. sector performance largely mirrored the impact of higher oil prices. The energy sector again stood out as the clear outperformer, gaining 2.8% for the week as crude oil climbed back toward the $100 per barrel mark. This followed the prior week where the energy sector was the only cyclical group to finish positive, rising 2.1% for the week.
- Friday’s session captured the prevailing tone: oil prices moved higher again on escalating geopolitical developments, Treasury yields jumped, and equities sold off broadly. Equities struggled under the weight of that and the FOMC shift to no rate cuts for now or soon it appears. What began as an oil-driven inflation scare has evolved into a broader repricing of monetary policy expectations. Crude remains elevated and volatile is keeping markets under pressure, with inflation fears and a “higher-for-longer”—or even “higher-again”—Fed outlook driving price action.
- Growth and rate-sensitive sectors led the downside, with consumer discretionary (-2.7%), information technology (-1.9%), and communication services (-1.5%) all posting notable losses. Real estate (-4.1%) and utilities (-5.0%) were among the worst performers as rising yields pressured valuation-sensitive areas of the market
For the week:
- S&P500 fell 1.9% (down 5.0% y-t-d),
- Dow slumped 2.1% (down 5.2%).
- Nasdaq100 dropped 2.0% (down 5.4%).
- S&P 400 Midcaps declined 1.3% (down 0.3%),
- Small cap Russell 2000 fell 1.7% (down 1.8%).
- Utilities sank 5.0% (up 4.4%).
- Banks rallied 1.6% (down 9.0%),
- Broker/Dealers recovered 1.0% (down 5.9%).
- Transports increased 0.7% (up 2.8%).
- Semiconductors added 0.3% (up 8.3%).
- Biotechs declined 1.0% (down 7.3%).
- With bullion slumping $527, the HUI gold index sank 14.7% (down 2.6%).
- Gold futures settled Friday $30.80 lower (-0.7%) at $4,574.90/oz, down -9.6% on the week. Spot Gold dropped 10.5% to $4,492 (up 4.0% YTD). Silver sank 15.7% to $67.945 (down 5.2%). Copper lost 6.6% (down 5%)
- WTI Crude futures settled Friday $2.41 higher (+2.5%) at $98.12 per barrel. WTI Crude slipped 48 cents, or 0.5% for the week (up 71% YTD). Gasoline jumped another 8.0% (up 92%)
- Natural Gas declined 1.1% to $3.095 (down 16%).
- Bitcoin was little changed at $70,539 (down 19.5%)
- U.S. Dollar Index declined 0.7% to 99.647 (up 1.3% y-t-d). On the upside, the Norwegian krone increased 2.1%, the Swedish krona 1.5%, the euro 1.4%, the New Zealand dollar 1.0%, the British pound 0.8%, the Australian dollar 0.6% On the downside, the South African rand declined 0.6%, and the South Korean won slipped 0.4%.
- Total money market fund assets (MMFA) expanded $38.7 billion to a record $7.886 TN – with a 35-week surge of $834 billion, or 17.5% annualized. MMFA were up $854 billion, or 12.2%, y-o-y – having ballooned a historic $3.272 TN, or 70.6%, since October 26, 2022.
Treasury Yields: (Friday)
- 2-yr: +6 bps to 3.89% (+16 bps this week)
- 3-yr: +8 bps to 3.91% (+16 bps this week)
- 5-yr: +9 bps to 4.01% (+14 bps this week)
- 10-yr: +11 bps to 4.39% (+10 bps this week)
- 30-yr: +11 bps to 4.96% (+5 bps this week)
- Benchmark Fannie Mae MBS yields surged 21 bps to 5.28% (up 23bps).
Highlights Last Week
Last week’s key Economic & Geopolitical Data/Events:
- US Oil Inventories WoW 13-Mar via EIA: Crude +6.156M (est -1.500M; Prev +3.824M) Cushing +0.944M (Prev +0.117M) Distillate -2.527M (est -1.5M; Prev -1.349M) Gasoline -5.436M (est -2.000M; Prev -3.654M) Refinery util 91.4% +0.60% (est 0.60%; Prev 1.60%) Prod: 13.668MMbpd Total exports 11.670MMbpd
- Factory orders increased 0.1% m/m in January following upwardly revised 0.4% decline (from -0.7%) in December. Excluding transportation, factory orders increased 0.4% after increasing 0.6% in December. Shipments of manufactured goods rose 0.5% after increasing 0.7% in December. The tepid level of business spending in January evidenced by the 0.1% increase in new orders for nondefense capital goods excluding aircraft.
- The Producer Price Index for final demand increased 0.7% m/m (consensus: 0.3%) following a 0.5% increase in January. The PPI for final demand, less foods and energy, jumped 0.5% m/m. PPI was up 3.4% y/y, versus 2.9% in January, and core PPI y/y was up 3.9%, v 3.6% in January. Uptick in producer prices was seen in both goods (+1.1%) and services (+0.5%), this higher inflation occurred before the war with Iran and subsequent surge in energy prices, which will foment concerns about a worsening inflation situation.
- MBA Mortgage Applications Index for the week ending March 14 decreased 10.9%, from a prior increase of 3.2%.
- Russia Is Sharing Satellite Imagery and Drone Technology With Iran Moscow has expanded intelligence sharing and military cooperation to help keep Tehran in the fight against U.S. and Israeli military might
- US House panel subpoenas Attorney General Bondi in Epstein probe – Reuters Attorney General Pam Bondi faces accusations that the Justice Department has concealed the names of powerful associates of Epstein in its release of documents.
- Unintended consequences of Iran War Australia’s Macquarie have withdrawn from bidding for a stake in Kuwait’s oil pipeline network worth up to $7 billion, two sources familiar with the matter said, becoming one of the first known investors to pull out of a Gulf deal due to the Iran war. Reuters sources say
- February pending home sales increased 1.8% (consensus: -0.8%), Prior -0.8% bounces off lowest level in the history of the series.
- Australian mining giants Rio Tinto & BHP announced their Resolution Copper joint venture RIO (55%) & BHP (45%) completed a land exchange, unlocking the next phase of one of the world’s largest untapped copper deposits
- US March NAHB housing market index 38 v 37 expected Prior 36 Current single-family home sales 42 vs 41 prior Prospective buyers 25 vs 22 prior Home sales expectations over the next six months 49 vs 46 prior
- Empire State Manufacturing Survey contracted to -0.2 (consensus 0.5) from a prior level of 7.1. New orders: 6.4 versus 5.8 last month, little changed, indicating a modest increase in demand. Prices paid (input costs): 36.6 versus 49.1 last month, down 13 points, showing slower cost inflation but still elevated. Prices received: 21.4 versus 22.2 last month, little changed, meaning selling price increases remain steady.
NB: The Bureau of Labor Statistics that gathers, analyzes and publishes the price indices has recently advised that a hiring freeze by the Trump administration has resulted in fewer prices being checked. A larger share of the CPI basket is being estimated by prices for comparable products or prices in other regions of the country in lieu of harder data
Economic summaries curated from AFR, Briefing, Reuters and Bloomberg
Central Banks Last Week
- Russia’s central bank cut 50bps and guided perhaps another cut at the next meeting.
- ECB left rates unchanged as expected. Main refi rate unchanged at 2.15% Deposit rate unchanged at 2.00%’ War poses upside risks to inflation, downside risks to growth Determined to ensure inflation reaches target Implications for medium-term inflation depend crucially on the magnitude of indirect and second-round effects. The market is now pricing in 64 bps in rate hikes this year for the European Central Bank as energy prices in Europe surge.
- Bank of England kept the Bank Rate at 3.75% in March 2026 as generally expected in a unanimous vote. MPC said “stand ready to act” which is code language for a pivot toward a hiking bias. The gilts curve exploded with the 2s yield up over 30bps, and markets learning toward a hike at the April 30th decision. One motivator is the war with Iran but it’s also an opportunity to abandon an easing campaign that was increasingly making little to no sense.
- Switzerland National Bank left its policy rate at 0% as widely expected. SNB warned markets against treating the franc as a safe haven by stating “Given the conflict in the Middle East, the SNB’s willingness to intervene in the foreign exchange market has increased. The SNB thereby counters a rapid and excessive appreciation of the Swiss franc, which would jeopardize price stability in Switzerland.”
- Sweden’s Riksbank held at a policy rate of 1.75% as widely expected. Updated explicit forward guidance pointed to a rate hold “for some time to come” that the numbers backed up by showing no move until possibly 2027 and only a single 25bps hike. Markets price a solid chance at a hike later this year and 50–75bps of tightening through to next year.
- Taiwan’s central bank CBCT left its benchmark rate unchanged at 2% as widely expected. Guidance incrementally hawkish. Governor Yang Chin-long said “If the conflict drags on, it could have a relatively large impact on energy prices, and correspondingly, a greater impact on global economic growth. Our monetary policy will move in a tighter direction; the key lies in the second quarter.”
- Bank of Japan held at a target rate of 0.75% as universally expected, but guidance was a touch more hawkish. Ueda flagged that more Board members were concerned about upside risk to inflation stemming from higher oil prices and emphasized Spring wage negotiations that are driving another strong gain. Markets slightly increased the odds of a hike at the April 28th meeting to 60% with June 85% priced for a hike in the wake of BoJ communications overnight.
- Federal Reserve No Change as expected. Available indicators suggest that economic activity has been expanding at a solid pace. Job gains have remained low, and the unemployment rate has been little changed in recent months. Inflation remains somewhat elevated. The implications of developments in the Middle East for the U.S. economy are uncertain. The Committee is attentive to the risks to both sides of its dual mandate.
- Reserve Bank of Australia raised its cash rate by 25bps to 4.1%, as widely expected Reserve Bank of Australia vote was 5-4. Policymakers said inflation had picked up materially in the second half of 2025, reflecting stronger capacity pressures in the economy. The board warned there is a material risk inflation will remain above the 2–3% target range for longer than previously expected. Rising fuel prices linked to the Middle East conflict were cited as a key risk that could add further inflation pressure.
- Bank of Canada left unchanged as expected Prior was 2.25% BOC says risks to growth are to the downside while inflation risks have gone up As the outlook evolves, we stand ready to respond as needed Recent data suggest that near-term economic growth will be weaker than anticipated in January The labour market remains soft
Week Ahead Catalysts:
Geopolitical: Chaos Ramps Up
- Market volatility is likely to persist into the coming weeks as markets grapple with whether temporary or more profound forces of change are upon financial markets due to unintended effects
- The extent of the Israel and US war with Iran, whether it widens or is a short lived one. The evolving situation in the Middle East for any signs of de-escalation and a possible resumption of shipping through the Strait of Hormuz.
- Venezuela updates
- Next moves with Russian leader Vladimir Putin and European and Ukraine leaders.
- For global central banks: BCCH, SARB, Banxico & Norges Bank latest monetary policy decisions
- The fourth-quarter reporting season lineup includes GameStop (GME), Smithfield Foods (SFD), Chewy (CHWY), Winnebago (WGO) and Jefferies (JEF)
- Key indicators:
- US, flash S&P Global PMI for March, February’s foreign trade prices, fourth-quarter current account balance, construction spending, the Chicago Fed National Activity Index, the Richmond Fed and Kansas Fed manufacturing indexes, final Q4 productivity and labor costs and the final University of Michigan consumer sentiment index for March.
- Canada,
- Mexico, Banxico latest monetary policy decision, trade data and mid-month inflation figures.
- Brazil, mid-month inflation and trade data.
- Chile, BCCh central bank decision on Tuesday (5pmET).
- Colombia
- Argentina,
- Peru,
- UK, flash PMIs, consumer price inflation, key retail sales
- Eurozone, flash PMIs are due for major European economies, including the Euro Area, Germany, France. In Germany, the GfK Consumer Climate Indicator, Ifo Business Climate Index. Euro Area flash consumer sentiment. Spain preliminary March inflation figures.
- Switzerland, SNB monetary policy
- Norway, Norges Bank interest rate decision.
- Denmark, snap parliamentary election. Prime Minister Mette Frederiksen and her Social Democrats are projected to deliver their weakest result in over a century, yet she is still expected to remain in power following a vote overshadowed by US President Trump’s renewed push for control of Greenland.
- Sweden, Riksbank monetary policy decision.
- Turkey,
- Russia, Bank of Russia monetary policy decision
- China, February industrial profits
- Japan, February inflation data, minutes from the BOJ’s January meeting, along with March PMI reports.
- Taiwan,
- Hong Kong, trade figures.
- India, March PMI data
- South Korea, producer prices, consumer and business confidence indicators.
- Pakistan,
- Malaysia,
- Philippines, trade figures
- Singapore, inflation data
- Hong Kong, inflation data
- Thailand, trade figures
- Indonesia,
- South Africa, SARB central bank rate on Thursday.
- Australia, March PMI data, February inflation figures
- New Zealand,
- Off-calendar risk could be resurrected with China, Russia North Korea 3 stooges.
Traders and investors had become increasingly fearless and in such a mood reshape the narrative to fit with a bullish or bearish mantra. In this vein stocks have moved on from tariff panic, faced with political fatigue have largely taken President Trump, gaffes and all in it’s stride.
Treasuries are also pressured by the influence the administration is trying to assert on the Fed. The relentless pressure to lower rates and the attacks on Powell unsettle the safe haven component of Treasuries. The demeaning tone towards the Federal Reserve has unappreciated costs such as for global investors concerns on the Trump administration Federal Reserve “reform” effort which drags the Fed into the political cesspool. Thus far the rabid leveraged speculating community appears to ignore the assault on Fed independence.
This helps us understand the fact that global bond markets are signaling a new paradigm of market yields increasingly disconnected from central bank policy rates. This has been notably since the Fed’s rate cutting cycle last year, long before Trump. Loose monetary policies are no longer automatically transmitted to lower bond yields. There are multiple reasons here; surging bond issuance, mounting debt levels, and structurally elevated inflation risk via tariffs, though this has not come to the fore yet (and may not).
Let’s Not Forget: Tech Giant Debauched Credit Scramble
Can’t say we didn’t warn you department:
Update Feb 27, 2026 Headlines: “Blue Owl Shares Post Worst Month Ever on Private Credit Fears.” “KKR BDC Slides on Rise in Troubled Loans.” “BlackRock Private Debt Fund Slumps After Slashing Dividend.” “Apollo’s MFIC Slashes Dividend, Marks Down Assets, Announces $100M Buyback.” “Private Credit Firm Invico Calls Investors to Manage Exodus Risk.” “No Fed, No Safety Net: Why Private Credit’s First Real Recession Will be its Moment of Truth.” “Blackstone Private Debt Fund Sees More Stress in Software Assets.” “Bain Warns Software Default Rate Risks Hitting Double Digits.” “Blackstone’s Schwarzman Reaped Near-Record $1.24 Billion in 2025.” Bloomberg: “Bank Shares Walloped by More ‘Cockroach’ Credit Woes, AI.” “Banks Trade Like We’re in the Midst of Crisis.”
Blue Owl’s y-t-d (2-months) losses to 29.4%. KKR down 31.2% y-t-d), Ares Management down 30.7%, Apollo Management down 27.7%), and Blackstone down 26.5%. These stocks are sending a strong Credit cycle signal.
January 12 – Bloomberg (Emily Graffeo): “At least $3 trillion is set to flow into data-center-related investments over the next five years, capital that will rely on the might of multiple areas of the credit markets to provide, according to Moody’s… Trillions of dollars will need to be invested across servers, computing equipment, data center facilities and new power capacity, and support the boom in artificial intelligence and cloud computing, the ratings firm said… Much of that capital will come directly from big tech companies, which are facing rising demand for data centers and the power needed to operate them. Six US hyperscalers — Microsoft Corp., Amazon.com Inc., Alphabet Inc., Oracle Corp., Meta Platforms Inc. and CoreWeave Inc. — are on track to hit $500 billion in data center investments this year, as capacity growth continues, said Moody’s.”
“Tech giants need so much money for their artificial-intelligence ambitions that Wall Street is developing new ways to get it for them. Details of some of the biggest AI infrastructure deals, including those involving Meta, OpenAI and xAI, are coming into focus, revealing lucrative, innovative—and in some cases risky—funding schemes. Exhibit One is the deal fund manager Blue Owl Capital struck with Meta in their joint venture to build a giant data center in Louisiana called Hyperion. Blue Owl is buying private equity in the deal and is receiving a debt-like guarantee from Meta if the partnership falls apart, an extraordinary protection… Another deal involving OpenAI and Oracle involves a lending syndicate of more than 30 banks… Tech titans are offering sweeteners in their deals because they need to offload risk as the cost of the AI arms race soars, threatening even the strongest competitors. Meta’s market value dropped by around $300 billion in a few days after Chief Executive Mark Zuckerberg warned about higher spending on AI… Banks and fund managers are writing big checks for now, but many are worried about how the complicated deals being signed today will perform when the AI frenzy calms down. Another concern is that each time tech companies take on lots of new debt, their cost of borrowing rises.” November 11 – Wall Street Journal (Matt Wirz)
Should the basis trade burst? Debasement Trade
Treasuries are prominent throughout levered strategies. They are also integral to scores of hedging strategies. Importantly, systemic deleveraging risks quickly escalate when Treasury yields surge in the face of “risk off” market dynamics.
March 6: Bloomberg after Iran War: “Credit Traders Are Unwinding Their Gigantic Bullish Position.” In a problematic development for highly levered trades (i.e., “basis” and “carry trades”), “swap” market volatility this week went into overdrive. The 30-year Treasury (vs. overnight swaps) swap rate dropped 5.6 this week to negative 79 bps, essentially matching the decline from “liberation day” week April 11th (down 5.7bps) – which was the largest drop since December 2022. The five-year inflation expectations “breakeven rate” surged 17 bps to an almost one-year high of 2.62%.
January 13 – Bloomberg (Alexandra Harris): “The basis trade has swelled to roughly $1.5 trillion, underscoring the need to closely monitor its size to avoid a repeat of the market eruption seen in 2020, according to Morgan Stanley strategists. The bank estimates the size of the strategy — employed by hedge funds to take advantage of small price gaps between Treasury cash markets and futures — has grown 75% since its 2019 peak. The size of the notional trade has outpaced the growth in Treasury bond issuance in recent years… The trade contributed to volatility in the markets in 2020 when cash bonds underperformed futures… imposing significant losses on hedge funds. That forced the Fed to buy trillions of dollars’ worth of bonds to keep markets running smoothly… At the time, the trade was roughly $500 billion in total — just a third of what it is today.”
We have seen the basis trade burst as crisis dynamics gain momentum. At this juncture the Fed and global central bank community will be faced with having to aggressively expand their balance sheets to accommodate speculative deleveraging and counteract acute systemic stresses. Markets seem to be taking the proven bet that the Fed will be forced into another aggressive round of QE despite elevated inflation risk to counter global market instability and deleveraging.
Stress remains almost across the board with “carry trades”, “basis trades” and especially the “swaps” derivatives marketplace. We have seen some unwinding the massive “basis trade” in Treasuries. To reiterate what we saw last week volatility so far seems about price discovery in the wake of US policy shocks rather than signs of market dysfunction
Washington’s Office of Financial Research [OFR] on Thursday Dec 4 with a weighty blog post, “Sizing the U.S. Repo Market” (Ashlyn Cenicola, Melanie Friedrichs, Robert Mann, and Luke M. Olson).
From the blog: “According to new data collected by the OFR, the U.S. repurchase agreement (repo) market averaged about $12.6 trillion in daily exposures in Q3 2025, a number that is about $700 billion larger than previous estimates. The repo market is one of the world’s largest and most important short-term funding markets, providing funding for securities dealers and serving as a cash management tool for banks. Despite this fundamental role, this market has historically had limited transparency.”
“Of the $12.6 trillion in daily average exposures in Q3 2025, $4.4 trillion was centrally cleared by the Fixed Income Clearing Corporation with another $3.1 trillion settled on Bank of New York Mellon’s (BNY’s) tri-party platform (excluding centrally cleared). NCCBR [non-centrally cleared bilateral repo] accounted for the remaining $5.0 trillion.”
“In Q3 2025, U.S. Treasuries collateralized 88.9% of exposures in the cleared repo segments, but only 61.8% of NCCBR exposures and just over half (52.6%) of the exposures in tri-party.”
Another round of massive QE is a matter of when and not if a problematic deleveraging takes hold, another momentous risk supportive of precious metals discussed only behind closed doors: The risk of global markets “seizing up” is not remote. The potential for financial meltdown should not be dismissed. This historic global Bubble will not work in reverse.
The Fed is expected to cut rates despite unprecedented speculative leverage with the “basis trades,” “carry trades,” derivatives, & other levered securities holdings. Each quadruple option expiration is larger than the prior one. Money Market Fund Assets inflated over $1 TN (16%) over the past year, while the “repo” market and Broker/Dealer assets continue their historic ballooning.
At this point, a major unwind of speculative leverage would trigger illiquidity, dislocation, and panic. That speculative excess and leverage took root across global markets over this most protracted cycle creates unprecedented systemic risk.
October 17 – Financial Times (Eric Platt, Kate Duguid and Amelia Pollard) “Investors in the $2tn leveraged loan market have warned that the abrupt collapse of First Brands Group is an early sign of trouble for a market where hasty deals and hurried due diligence have become commonplace. First Brands was among the largest issuers of loans bought by collateralized loan obligations, investment vehicles that buy up small slices of hundreds of individual corporate loans. CLOs have become popular with insurers and other big investors who bet that by spreading their lending across many different companies they are protected from the pain of defaults in one or two businesses. But the rapid bankruptcy of First Brands… has raised concerns over the rapid growth of the CLO market, which has provided almost unquenchable demand for the leveraged loans that private equity firms often use to finance their acquisition sprees. Some fund managers worry that a spate of CLO losses could cause Wall Street’s securitization machine to sputter. ‘Inside credit markets for more than a year, there has been a grudging recognition that there was and is a series of credit problems that could be substantial and could be dangerous to the overall economy,’ said Andrew Milgram, chief investment officer of Marblegate Asset Management, a distressed-debt investor.”
October 10 – Bloomberg (Jeannine Amodeo and Aaron Weinman): “The US leveraged loan market is coming under further pressure with its second pulled deal in a week and a slew of investor-friendly changes made on other transactions to help get them over the line. The latest casualty is drugmaker Mallinckrodt, which shelved a $1.49 billion offering on Friday… It follows a pulled deal from specialty chemicals producer Nouryon earlier this week, marking the eighth deal to be yanked from the market since August…”
October 9 – Bloomberg (Amedeo Goria): “Bloomberg’s European leveraged loan index has fallen almost half a point in the past week, the steepest drop since President Donald Trump’s tariff announcements upended global markets in April.”
Where we are at is best summed up by Federal Reserve Chair Powell at last month’s FOMC:
“So we have a situation where we have two-sided risk, and that means there’s no risk-free path. And, so, it’s quite a difficult situation for policymakers.”
Apparent anomalies in how markets are responding to rash and sudden developments may have sound explanations and could stabilize, versus extrapolating these developments with extreme and premature views such as how they finally represent the end of longstanding dollar dominance and US exceptionalism. Today’s critical issue is untenable market structure engulfed by speculative leverage, a culture of speculation and egregious financial excess. All this with potentially problematic derivative strategies, and high-risk lending.
Epic Monetary Inflation
It has been clear for a while that economic and market analysts have got it all wrong so far, tends to happen when all follow each other and are doused with political bias. Now even worse the data collection and reporting have been greatly exaggerated, or plainly wrong. With the effects of loose financial conditions fueling upside surprises in economic activity and inflation, what is correct? Meanwhile the markets have blinkers on as loose financial conditions fuel the moves, until last Friday’s jobs bomb dropped, but that took just a weekend to forget. The economy has been performing much better than projected by the experts and inflation much tamer than also projected by those experts. Powell had been basing his rates policy on that, turns out the jobs situation isn’t as it seemed.
Treasuries are also pressured by the influence the administration is trying to assert on the Fed. The relentless pressure to lower rates and the attacks on Powell unsettle the safe haven component of Treasuries. The demeaning tone towards the Federal Reserve has unappreciated costs such as for global investors concerns on the Trump administration Federal Reserve “reform” effort which drags the Fed into the political cesspool. Thus far the rabid leveraged speculating community appears to ignore the assault on Fed independence.
This helps us understand the fact that global bond markets are signaling a new paradigm of market yields increasingly disconnected from central bank policy rates. This has been notably since the Fed’s rate cutting cycle last year, long before Trump. Loose monetary policies are no longer automatically transmitted to lower bond yields. There are multiple reasons here; surging bond issuance, mounting debt levels, and structurally elevated inflation risk via tariffs, though this has not come to the fore yet (and may not).

Tariff Watch

Risk On, Risk Off
There are today two notably powerful countervailing forces. The “risk on” squeeze dynamic is spurring speculative leveraging and the perception of abundant liquidity. At the same time global bond markets signal waning demand and fledgling liquidity issues. (the JGB and gilt issues were less than two weeks ago) Strong risk market gains, the perception of liquidity abundance, and attendant complacency work to mask mounting risks to Treasury and global bond market stability.
What also hasn’t changed is the concentration of ‘bets’. magnificent 7 or MAG7 related margin debt, options, and other related derivatives have produced extraordinary liquidity effects. It all becomes self-fulfilling, until it doesn’t. Rising stock prices fuel self-reinforcing liquidity creation, while sell-offs heighten risks of illiquidity, deleveraging, and market dislocation. FOMO trumps all at his time.
The egregious Treasury “basis trade” leveraging drives unprecedented overall hedge fund leverage. Household market participation is unparalleled, with the proliferation of online accounts, options trading, and herd-like speculation creating extraordinary market-moving power.
Gambit [ˈɡambət] noun “a device, action, or opening remark, typically one entailing a degree of risk, that is calculated to gain an advantage’
Geopolitical contagion impacts
The consequences of inflationism and monetary disorder have been fundamental to the rapidly shifting financial markets but also the geopolitical landscape. We had a week Russia’s Putin, North Korea’s Kim bookending China’s Xi in a massive military parade and claiming, “new world order” last year.
“North Korean leader Kim Jong Un and Russia’s Vladimir Putin flanked Xi Jinping at a massive parade of military might in Beijing…, capping a week of diplomatic grandstanding by the Chinese president and his allies against the West. In unprecedented scenes, Xi shook both their hands and chatted with the pair as they walked down a red carpet by Tiananmen Square, with Putin to Xi’s right and Kim to his left. The event, ostensibly to mark 80 years since the end of World War II, was a chance for Xi to put on an extravaganza to showcase China’s military prowess and bring together friendly leaders to send a message to the rest of the world. Kicking off the parade, President Xi warned the world was still ‘faced with a choice of peace or war’, but said China was ‘unstoppable’. China’s enormous new intercontinental ballistic missile DF-5C, with a range of 20,000 kilometres, counted prominently among the tonnes of hardware on display.” September 3 – AFP
Prospects for inflation are both troubling and highly uncertain. The trade war with China will accelerate decoupling between the world’s great consumer and producer economies, a dynamic conducive to supply-chain problems and ongoing inflationary pressures. A seizing up of global markets has the potential to unleash the forces of economic depression and deflation. Globalization has been a powerful force for lower goods prices., something that in rebuilding the U.S. industrial base would see a high-cost producer replace a low-cost producer.
Lest We Forget: Currency Volatility at Multiyear Highs
A reminder of the impact of currency and more specifically the carry trade over asset markets from 2024 to now . We have seen continued volatiltiy in Yuan, Yen and the Won to name a few that are important for world trade.
Turbulence in currency markets is likely to get even worse as we see the violent swings in gold, silver and cryptocurrencies. markets touted by their proppoments as safe havens and protectors of wealth. Ever escalating trade war shakes up the global economic order. The dollar, its peers, metals and crypto have been whipsawed by some of the sharpest price swings since the 2008 financial crisis. Options volumes surge to new records and uncertainty around the globe pushs expectations for volatility.
A dangerous market for those not trading with discipline and booking profits. Not one with emotion and preset views dictated by hope, politics or a talking head’s opinion.
Debt …. Keeps Building
via Fed’s Q3 2025 Z.1 Analysis via Credit Bubble Bulletin
Important note: The Q3 Repo slowdown and Q4 funding market tightening/instability are not coincidental. The expansion of repo funding for levered speculation creates liquidity, while deleveraging is a drag on liquidity. At this point in the cycle, even a slowdown in new leveraging will be felt in funding markets.
- Non-Financial Debt (NFD) expanded a gut wrenching $1.711 TN (nominal), or 8.8% annualized, during Q3 to a record $79.671 TN driven by a $1.053 TN jump in outstanding Treasury Securities. This was the strongest quarterly NFD growth since massive covid Q2 2020 Treasury issuance. NFD inflated $3.208 TN y-o-y and $6.709 TN over two years. For comparison, NFD expanded $2.468 TN during pre-covid 2019 (2000-2019 avg. $1.839 TN). NFD ended September at a non-covid record 256% of GDP.
- Household Sector Debt expanded at a 4.07% rate, the strongest pace of borrowing since Q3 2022. Corporate debt growth was down slightly q-o-q to 4.50% – but was up from Q3 2024’s 3.64%.
- Notable changes in Fed Liabilities. Reverse Repos (where money funds and financial institutions park short-term funds with the Fed) sank $412 billion to $49 billion, the low back to Q4 2000 – and was down from Q4 2022’s peak of $2.554 TN. Meanwhile, the Liability “Treasury General Deposit Account” jumped $434 billion to $891 billion (high since Q1 2021). Federal Reserve Assets were little changed (down $6bn) during Q3 at $5.731 TN (down $495bn y-o-y). Treasury holdings increased $20 billion to $3.831 TN, while Agency Securities declined $19 billion to $1.805 TN.
- Total system Repo Assets contracted $411 billion to $6.298 TN, a decline explained by the drop in Fed “reverse repos.” And while system Repo Liabilities declined $272 billion from Q2’s record level to $7.828 TN, Repo Liabilities were still up $486 billion y-o-y (6.6%).
- Broker/Dealer Assets inflated another $108 billion, or 7.2% annualized, to a record $6.126 TN, with one-year growth of $618 billion, or 11.2% annualized. The asset “Loans” rose $49 billion (24% annualized) to a record $867 billion, with notable one-year growth of $183 billion, or 26.8%. Loans have doubled since the end of 2019. Broker/Dealer Debt Securities holdings dipped $24 billion from Q2’s record to $1.256 TN, while one-year growth was a potent $230 billion, or 22.5%.
- Broker/Dealer Repo Assets were little changed at $1.855 TN, with Repo Liabilities slipping $14 billion from Q2’s record to $2.699 TN (up $191bn y-o-y). Miscellaneous Assets gained $88 billion to a record $1.295 TN (up $147bn y-o-y), as Miscellaneous Liabilities rose $61 billion to a record $1.327 TN (up $151bn y-o-y).
- Money Market Fund Assets (MMFA) surged $293 billion, or 15.7% annualized, during Q3 to a record $7.774 TN. This increased y-o-y growth to $935 billion (14.3%); 12-quarter growth to $2.690 TN (53%); and 23-quarter growth to an astounding $3.772 TN (94%). During Q3, MMFs reduced Repo holdings by $333 billion (to $2.772 TN), while boosting Treasuries by $618 billion to a record $3.232 TN. Treasury holdings were up $573 billion, or 23.4%, y-o-y and $2.110 TN, or 188%, over 23 quarters. MMFs increased Agency Securities holdings by $6 billion to $999 billion, with one-year growth of $205 billion (28%).
- Banking system (“Private Depository Institutions”) asset growth slowed to $201 billion (2.8% annualized) – to a record $28.772 TN. Bank Assets were up $1.095 TN y-o-y. Total Loans expanded $165 billion, or 4.3% annualized, to a record $15.521 TN – with one-year growth of $727 billion (4.9%). Debt Securities holdings expanded $115 billion, or 7.3% annualized, to $6.447 TN. Treasury Holdings rose $92 billion (19.8% ann.) to a record $1.940 TN, with six-month growth of $200 billion (up $271bn, or 16.2% y-o-y). Bank Treasury holdings have doubled since Q1 2020.
- Corporate borrowings increased from a notably weak Q2 to $143 billion (3.5% ann.), with one-year growth of $465 billion, or 2.9%. Interestingly, Corporate asset-backed securities (ABS) rose $63 billion (16.3% ann.) to a record $1.596 TN, with one-year growth of $169 billion, or 11.8%.
- Mortgage Credit $206 billion (3.9% ann.), Total Mortgage growth was the strongest since Q4 2022. Growth in Home Mortgages was flat at $116 billion (3.2% ann.), while Commercial and Multifamily Mortgages expanded $45 billion (4.6% ann.) and $40 billion (6.8% ann.) – both the strongest expansions in at least two years.
The Household balance sheet remains fundamental to Bubble analysis.
- Household Assets surged $6.291 TN, or 12.8% annualized, to a record $202.830 TN. The $13.604 TN two-quarter rise was the strongest since Q1/Q2 2001 (covid crisis recovery).
- With Household Liabilities increasing $227 billion during Q3, Household Net Worth inflated $6.064 TN, or 13.8% annualized, to a record $181.632 TN.
- Household Net Worth to GDP rose to a non-covid record 652%. For comparison, this ratio ended 2019 at 527%, with previous cycle peaks 487% (Q1 2007) and 443% (Q1 2000). Net Worth inflated $12.912 TN, or 7.7%, over the past year, and $38.751 TN, or 27.1%, over three years. For an explanation of economic resilience, look no further.
- Real Estate holdings dipped $287 billion to $52.057 TN.
- Meanwhile, holdings of Financial Assets surged $6.437 TN, or 19.1% annualized, during Q3 to a record $141.234 TN (non-covid record 454% of GDP).
- Debt Securities holdings gained $191 billion (12.9% annualized) to a record $6.133 TN, with a three-year gain of $2.453 TN, or 67%. Household Treasury holdings jumped $139 billion (19.8% ann.) to a record $2.961 TN, with an unprecedented three-year surge of $1.835 TN, or 163%.
- Equities and Mutual Funds surged $5.037 TN, or 37% annualized, to a record $59.590 TN (3-yr gain $24.530 TN, or 70%). Equities/Mutual Funds rose to a record 192% of GDP, compared to previous cycle peaks 105% (Q3 ’07) and 116% (Q1 2000).
- Household Money Market Fund (MMF) holdings swelled another $186 billion to a record $5.035 TN. For comparison, Total Deposits increased only $22.4 billion during the quarter to $14.756 TN. Over three years, MMF inflated a historic $2.104 TN (72%), while Total Deposits declined $448 billion (2.9%). What percentage of American households actually invest in money market funds?
Rest of World (ROW) balance sheet
- ROW holdings of U.S. financial assets were at about $7 TN in 1999. For Q3, ROW assets inflated $3.582 TN, or 23.7% annualized, to a record $64.121 TN. ROW Assets ballooned $7.661 TN, or 13.6%, y-o-y, and an incredible $25.405 TN, or 66%, over 20 quarters. ROW assets to GDP ended Q3 at a record 206% of GDP. This compares to previous cycle peaks 119% (Q4 ‘07) and 82% (Q3 2000).
- ROW Debt Securities holdings were up $345 billion (9.0% ann.) for the quarter, and $909 billion y-o-y (6.1%) to a record $15.707 TN. Treasuries rose $142 billion (6.2% ann.) and $554 billion y-o-y (6.4%) to a record $9.269 TN. Holdings of Corp Debt jumped $150 billion (13% ann.) and $345 billion (7.8%) to a record $4.768 TN. Equities and Mutual Fund holdings surged $1.597 TN, or 32.5% annualized, to a record $21.235 TN, with notable one-year growth of $3.531 TN, or 20%.
- ROW continues to be a major Repo market operator. Repo Assets expanded $90 billion (23.7% ann.) during Q3 to a record $1.597 TN, with one-year growth of $198 billion (14%). Repo Liabilities gained another $43 billion (8.6% ann.) to a record $2.047 TN, with one-year growth of $271 billion (15.2%). Over 20 quarters, Repo Assets inflated $737 billion (86%), with Repo Liabilities ballooning $841 billion (70%). Heck of a Bubble.
An overheating economy, coupled with tariff and trade war risks, creates a bond market challenge.
From March 2025 – credit card debt was delibitating then – a year later it is strangling communities, hence the Trump 10% cap move: “Several Southern California cities have the most credit card debt per household in the U.S., a new WalletHub study found. Santa Clarita ranked first out of 181 U.S. cities, with a household average of about $22,753 in credit card debt, and a total of about $1.7 billion in debt for its 228,000 residents, according to data taken from the U.S. Census Bureau and TransUnion… Chula Vista was second, with an average of $20,567 in credit card debt per household, and a total of $1.8 billion among its 275,000 residents.” March 21 – Los Angeles Times (Sandra MacDonald)
Basis and Carry Trade Sustainable?
Risk Matters: Don’t forget the August 5th, 2024, Carry Trade Shake:
Discipline with your trading rules, especially as liquidity falls
There is a reason we have strict trading rules here based on psychology, math, experience and avoiding false narratives and dribble out there. That said pay attention to the time of year, the bonus pay dates (no we aren’t being cynical), tax markings and look the previous run ups into Dec 31. Don’t let the grifters out their sway you, VIX is historically low, what does that tell you? Protection is cheap and the market is complacent with no fear. Here endeth the lesson.
Two paths to bankruptcy: gradually and suddenly. – Ernest Hemingway
Where is the Fear in Instability?
Leveraged speculation, including “basis trades,” “carry trades” and run deep and why the yen and Mexican peso are deeply relevant to this whole structure.
Compressed risk premiums and CDS prices are indicative of complacency. Markets behave this way when there is some underlying monetary disorder (dislocation in liquidity creation). What all this does for markets is keep risk measures on, we see in the vicious VIX fails and short-term option volumes. It is when the risk avoidance measures, or tolerance fails this can trip up the whole structure of buying and cycling through risk assets.

In the backdrop we have war abroad in the Ukraine and Middle East, unsettled relations between Taiwan and China. Now through Venezuela and an unpredictable US Adminisatrion in the mix. At home in the US universities and cities to the North have become a quagmire of protest, illegal immigration placement and political vitriol that have deeply divided these regions. The cost of living through it all has sent many working through middle class families to the brink and beyond, insurance costs have risen over 100% in a year in some cases to name just one inflation cost that politicians lie about. While complacency reigns supreme in equities, bonds are awake to the risk out there.

“We have a market trying to interpret the Fed who is trying to find out how they can interpret their long-only portfolio at a risk parity where rates cannot rise.”– MoneyNeverSleeps

Our weekly reminder for risk, timely given the V shape to ATH. The downside is clear with the absence of moral hazard from repeated Federal Reserve market bailouts in an environment of some would say obscene liquidity pumps. Pure greed is the other part, not wanting to miss out. The obvious question is, how deeply ingrained is this attitude through the markets? How do we ween the markets off this continuous dip feed? At this point the Central Banks have kicked that answer down the road.
Our take remains the Fed is not just focused on inflation and jobs but risks such as the commercial real estate debacle, the high US dollar and the massive Federal debt refunding cost.
We need to grasp all the risks to be wary of but not ignore price reaction. We always talk here about expect the unexpected and now that is front and center, gage the market’s reaction, the market is always right and that’s why we focus on the crowd psychology aspect.
Unsuspecting investors in their millions have or will lose meaningful amounts of their savings. They bought into the mania, threw caution to the wind, and will suffer the consequences regardless of the warnings of unsustainability. The reason we started TradersCommunity was for situations like this many moons ago. Beware of those ‘experts’ who never saw the sell off and chided you for believing it now claim to be gurus measuring risk. It’s a bit late when some of these stocks and markets are down 50-90%. Beware of those who claim long term investment when it all goes wrong. Anyhoo..
Oh China
China has gone from bad to worse. Back in September 2024 Xi Jinping promised to spend whatever it takes to reach growth targets as he tapped the reflation panic button. Here we are in 2026 and the constant money pump has had no positive effect. A Reuters article placed Beijing’s stimulus at $1.4 TN by mid 2025. On top of a system locked in massive credit expansion, upwards of $5 TN annually. He is pushing hundreds of billions to the stock market, hundreds of billions to the festering local government sector, hundreds of billions to the to attempt to arrest the slide in the apartment markets.
Any pushback to fledgling tightening these days ensures excessively loose financial conditions.
Geopolitical Tinderbox

Israel versus Iran
PART A – Stock Markets
Global Stock Markets Performance This Week

Highlights This Week – USA
- S&P500 fell 1.9% (down 5.0% y-t-d),
- Dow slumped 2.1% (down 5.2%).
- Nasdaq100 dropped 2.0% (down 5.4%).
- S&P 400 Midcaps declined 1.3% (down 0.3%),
- Small cap Russell 2000 fell 1.7% (down 1.8%).
- Utilities sank 5.0% (up 4.4%).
- Banks rallied 1.6% (down 9.0%),
- Broker/Dealers recovered 1.0% (down 5.9%).
- Transports increased 0.7% (up 2.8%).
- Semiconductors added 0.3% (up 8.3%).
- Biotechs declined 1.0% (down 7.3%).
- With bullion slumping $527, the HUI gold index sank 14.7% (down 2.6%).


Highlights – Europe Stocks
European stocks were under heavy selling pressure. Europe’s STOXX 600 Bank Index was clobbered 8.2%, the largest weekly loss since “liberation day.” Italian banks sank 9.6%. UK’s FTSE 100 equities index dropped 5.7%. Losses included France’s CAC40 at 6.8%, Spain’s IBEX 7.0%, Italy’s MIB 6.5%, and Germany’s DAX at 6.7%.
- U.K.’s FTSE equities index sank 3.3% (down 0.2% y-t-d).
- France’s CAC40 dropped 3.1% (down 5.9%).
- German DAX equities index sank 4.6% (down 8.6%).
- Spain’s IBEX 35 equities index fell 2.0% (down 3.4%).
- Italy’s FTSE MIB index slumped 3.3% (down 4.7%).
Highlights – Asia Stocks
- Japan’s Nikkei 225 Equities Index declined 0.8% (up 6.0% y-t-d).
- South Korea’s Kospi rallied 5.4% (up 37.2%).
- India’s Sensex equities index was little changed (down 12.5%).
- China’s Shanghai Exchange Index slumped 3.4% (down 0.3%).

Highlights – Emerging Markets Stocks
- Brazil’s Bovespa index declined 0.8% (up 9.4%),
- Mexico’s Bolsa index dropped 2.4% (down 0.4%).
- Turkey’s Borsa Istanbul National 100 index slipped 0.3% (up 15.9%).
Highlights – Australian Stocks
- Australia’s ASX 200: Friday -0.8% to 8428.4 (-2.2% on the week) (ATH Close 9094.7, intraday 9115.2)
- S&P/ASX 200 Index fell for a third consecutive week as rising energy costs caused by the war in the Middle East war started on February 28. The index has lost 8.4 per cent since the war began, erasing almost $280 billion in value.
- Friday:
- Materials & Miners: With gold’s biggest weekly drop since March 2020 at the onset of COVID-19, Greatland Resources fell 7.3% to $10.11, Ora Banda Mining dropped 7.8% to $1.18 and Newmont lost 2.6% to $142.46.
- Energy: Oil pulled back from its highest close since July 2022. Woodside Energy rose 1% to $34.04 and Santos fell by 0.5% to $7.98, Ampol added 0.4% to $33.11 and Viva Energy fell 2.9% to $2.36 despite increased government refinery support. Coal miners rose after Reuters reported strikes had damaged 17% of Qatar’s LNG capacity, with repairs potentially taking years. Yancoal gained 3.5% to $8.31 and Whitehaven Coal rose 3.9% to $9.30.
Technical Analysis
Technical Analysis of key markets via KnovaWave
S&P/ASX 200
- Australia’s leading share market index and contains the top 200 ASX listed companies by float-adjusted market capitalization. Accounts for ~77% of Australia’s equity market (December 2025).
- ASX 200: Friday 13/20 8428.4 -69.40 (-0.8%) (-2.2% on the week) (ATH Close 9094.7, intraday 9115.2)
Australian shares rebounds off the median line in an upward channel off its ABC correction of ATH.

Commonwealth Bank (ASX)
Commonwealth Bank on Friday rose 1.3% as an expected RBA interest rate rise next Tuesday would boost net interest margins. National Australia Bank rose 1.5% to $47.11. CBA is down from its intraday record of $192 in 2025.

“US equity markets are moving more money than ever before, blowing past $1 trillion in shares traded each day as heavy volume becomes the new norm. The surge marks a sharp step-up from a year ago. Equity turnover averaged a record $1.03 trillion in January, a roughly 50% increase from the same period in 2025… More than 19 billion shares traded hands daily over the span, the second-most ever… The jump reflects a broad-based increase in participation across the market. Mom-and-pop investors and institutional players alike have become more active as US stocks hover near record highs… ‘There’s more trading from retail, pod shops and hedge funds, and market makers, while automated trading is more prevalent than ever,’ said Bloomberg Intelligence… analyst Jackson Gutenplan.” February 10 – Bloomberg (Alexandra Semenova)
S&P 500
Daily: The SPX has traded like clockwork hitting the 78.6% extension right on cue into the Trump election.
Background: The move fueled by the violent ABC for the 5 waves up for SPX continue right into bottom of the median line to give us an (a) or C of a 4. with impulse after completing 5. Reversed hard with energy fueled from the power impulse down from near +1/8 ATH. On the way up (just like down) It accelerated after it broke the Tenkan through the rejected Kijun and then the Kijun to close back over the median and 8/8. Bulls this was a (ii) of a 5. Bears this is a a-b of a C off a completive V of degree. We watch if this low was a (iii), (a) or C. Will determine if sharp ABC completed off all-time highs. We have to respect the number of alternatives of degree of 5. With such trends keep it simple support is Tenkan and Kijun and watch for ABC. No fear is the driving element.

The break up was from above the 200dma. The balance from sharp reversal after the initial 3 wave down from the SPX wave 5 extension as Covid19 fed impulse accelerated under the Tenkan. From there we had seen the ABC or 1-2-3 spinning around the 61.8% of the move. Support began at the October 2019 lows. A manic wave 5 or 3 of some degree was a resolution for the ages. Note the 100% extension from the emotive element and MM levels when the spit kicks in. A manic wave 5 or 3 of some degree was a resolution for the ages. Note the 100% extension from the emotive element and MM levels when the spit kicks in

Weekly: The weekly confirms the daily sequence into the 78.6% extension.
Background: The reenergized SPX tripped in 3 to test recent break up at Tenkan from there we had had a powerful rally to ATH. Again notice what happened “Each new high has evolved after testing Tenkan key support which is the next line after Friday’s dump & minor bounce.” We watch for a spit of a spit Extensions are difficult to time, keep it simple.

Key for the impulse higher was the spit or retest of MM 8/8 and Tenkan San, which held with the previous highs and Tenkan. To repeat “We look for 3 waves down and reactions to keep it simple with the alternatives in the daily.” Keep an eye on the put/call ratio with recognition to the sheer size of contracts AND keep in mind the stimulus distortion. The spit per channel fractal and Adams rule launched back over the cloud where we were encased AND we back tested it. Watch if a spit or clear break support as Chikou rebalances
Dow Jones
NVIDIA (NVDA) and Sherwin-Williams (SHW) replaced Intel (INTC) and Dow Inc. (DOW) in the Dow Jones Industrial Average starting on Friday, November 8, 2024

NASDAQ 100
The Nasdaq100 (NDX) declined 2.4% this week, closing at 19,281, only 56 points, or 0.3%, above the March 13th close. From March 13th lows to this week’s (Tuesday) high, the NDX rallied about 6%, a so far notably unimpressive rally from the previous steep one-month decline (from the 22,223 February 19th high). The Bloomberg MAG7 Index closed the week only slightly above March 11th intraday lows, with the S&P500 ending the week 1.4% off March 13th trading lows. At this critical market juncture, further weakness risks acute instability. – March 28

Background: Fuel was after it broke and held the weekly Tenkan to see a spit of a spit fail which is completive of 5 of some degree with Chikou rebalancing. From there we sold off right to Tenkan (as did SPX) and bounced hard Support Tenkan to Kijun. Watch Chikou for divergence for continuation or failure. Divergence with Russell also a clue.

Russell 2000
The small cap Russell RUT broke out of multi-year flag and then spat the previous high. A long delay from SPX and NDX new ATH’s indicative of the high interest rates affect on Small Caps versus Mega Caps. This is the index showing more of the fast money crowd and trades like it. Needs to get traction in here for bulls.


US Stocks Watch
VanEck Semiconductor ETF (SMH)
- SMH equity ETF with 26 individual holdings. The top holdings are NVIDIA 19.86%, Taiwan Semiconductor Manufacturing Company 10.42%, Broadcom at 7.70%, Micron Technology at 5.50%, Lam Research at 5.30%, ASML Holding N.V. 5.26%, KLA Corporation 4.74%, Texas Instruments 4.60%, Advanced Micro Devices 4.56%, Applied Materials 4.54%


Investors (and algos) will focus on the conference calls and outlooks.
NVidia $NVDA
- NVIDIA has a pronunced influence on the US and global stock market through its leadership in semi conductors and therefore AI. Nvidia’s GPUs are now used in over 90% of AI applications.
- NVDA is primarily owned by institutional investors (around 70%) and individual shareholders (around 30%). The founder and CEO, Jensen Huang, is Nvidia’s top individual shareholder (around 3.5-3.8%). As of January 9, it is held in a total of 602 ETFs such as SPY, QQQ, DIA, SOXX, SMH, SMH, NVDW, USXF, FDG snd SEMI to namea few.

Nvidia Shares are up roughly 28-fold in the past five years.
The impact was amplified given trading had boomed in products that allow investors to amp up bets on the world’s most popular equities, with investors pouring a record of more than $6.5 billion into such “single-stock ETFs” in early 2025, vehicles that track just a single company but use derivatives to intensify bullish or bearish wagers.
The move tracked by the KnovaWave extension model followed the announcement of NVDA 4/1 split come levels off the energy break NVidia hadn’t looked back with many gaps below until it hit the 2.618 target of the exhaustion phase. We saw another power move off the $200 retest (old $800) & earnings off $300 which retested. It is a clear leader of SOX and SMH among other look for cues there and ABC failures for changes.
Apple $AAPL
Apple gently motored up to new ATH over the massive $160 then $170 thru to $180 gamma level to new ATH, similar patterns to $280. These levels will be key energy levels. Support from previous highs, resistance now Fibs and Murrey Math levels. Remember the impact $AAPL has, at least short term on all the major indices.

Tesla $TSLA
Shares of Elon Musk’s EV-maker surged to new highs in 2025 after being trashed after a pile on by Democratic leaders at one point.

Exxon Mobil $XOM

State Street® Energy Select Sector SPDR® ETF XLE
XLE ETF with a total of 25 individual holdings. The top 10 holdings are Exxon Mobil stock at 24.13%, Chevron at 17.32%, ConocoPhillips at 6.83%, The Williams Companies at 4.46%, SLB N.V. at 4.45%, EOG Resources, at 3.89% KMI Kinder Morgan at 3.69% PSX Phillips 66 at 3.62% BKR Baker Hughes at 3.57% Valero Energy at 3.52%
For February energy names were amongst the strongest
- Occidental Petroleum: +18.45%
- Baker Hughes: +15.22%
- Exxon Mobil: +9.91%
- Chevron: +9.90%


Freeport – McMoRan $FCX
A go to for copper investors, hampered the stock in 2025 with the mine disaster in Indonesia.

VanEck Gold Miners ETF (GDX)
The GDX currently holds 52 individual stocks, the top holdings are Newmont Corp 8.98%, Agnico Eagle Mines 8.86%, Barrick Mining Corp 7.41%, AngloGold Ashanti Plc 5.06%, Wheaton Precious Metals 4.96%, Franco-Nevada Corporation 4.88%, Gold Fields ADR 4.76%, Kinross Gold 4.57%, PAAS Pan American Silver Corp. 3.85%, Northern Star Resources 3.18%
Newmont dropped 4.9% Friday to $A167.60 as the world’s largest gold producer said it expected output to fall about 10% this year due to planned upgrades at several mines.


iShares Silver Trust (SLV)
The iShares® Silver Trust (the ‘Trust’) seeks to reflect generally the performance of the price of silver.


Part B: Bond Markets
Global 10 Year Bonds This Week

Highlights – Treasuries
- U.S. Treasuries complex deep in the red for the week, making for a continuation of a three-week selling streak spurred by inflationary concerns stemming from the sharp rise in the price of oil and uncertain maritime security in the Persian Gulf’s shipping lanes.
- Treasuries yields on the 10-yr note and shorter tenors to levels not seen since late July while the 30-yr yield climbed to its highest level since early September.
- Altogether, this made for the third consecutive week of selling with the 2-yr yield now up 53 basis points for the month while the 10-yr yield has risen by 43 basis points since the end of February.
- Rate cut expectations have essentially vanished with the market now considering the potential for a hike near the end of the year if high energy prices persist.
- WTI crude climbing past $98/bbl.
- U.S. Dollar Index rose 0.4% to 99.64, narrowing this week’s loss to 0.9%.
- Total money market fund assets (MMFA) expanded $38.7 billion to a record $7.886 TN – with a 35-week surge of $834 billion, or 17.5% annualized. MMFA were up $854 billion, or 12.2%, y-o-y – having ballooned a historic $3.272 TN, or 70.6%, since October 26, 2022.
- Total Commercial Paper declined $14.7 billion to $1.395 TN. CP expanded $11 billion, or 1.0%, y-o-y.
- Yields at W/E:
- 2-yr: +6 bps to 3.89% (+16 bps this week)
- 3-yr: +8 bps to 3.91% (+16 bps this week)
- 5-yr: +9 bps to 4.01% (+14 bps this week)
- 10-yr: +11 bps to 4.39% (+10 bps this week)
- 30-yr: +11 bps to 4.96% (+5 bps this week)
- NB: At Close 3/20/26
During Q3, MMFs provided key demand for outsized Treasury issuance. Treasury Securities surged $1.053 TN (nominal) during Q3 to a record $29.572 TN, with one-year growth of $1.985 TN. Treasuries inflated $3.941 TN (15.4%) over two years and a staggering $12.943 TN, or 78%, over the past 23 quarters. Outstanding Treasuries have ballooned five-fold (up $25.078 TN) since 2007.
“For Q3, think of it in terms of the money fund complex shifting holdings from Fed Reverse Repos to Treasury Bills, which shifted the Fed’s Liabilities from Repos (owed to MMF) to the Treasury’s General Deposit Account.” via Credit Bubble Bulletin
Relentless pressure on the Fed to lower rates and the attacks on Powell unsettle the safe haven component of Treasuries. The demeaning tone towards the Federal Reserve has unappreciated costs such as for global investors concerns on the Trump administration Federal Reserve “reform” effort which drags the Fed into the political cesspool. Thus far the rabid leveraged speculating community appears to ignore the assault on Fed independence.
What that community sees is the inflating price levels, and bathing in it. By last week the Nasdaq100 has returned 18% since the Fed began cutting rates (9/18/24). Money Market Fund Assets have inflated $769 billion, or 15% annualized. Gold has surged 30.6%, Silver 25.1%, Platinum 40.2%, and Copper 33.0%. Bitcoin prices have almost doubled.
“Bundesbank President Joachim Nagel said a strong US Treasuries market is good for everyone, even as investors have turned to German bunds. ‘It is not good news that there is a lot of doubt regarding the safe haven of US Treasuries,’ he told Bloomberg Television… ‘We need a good US Treasuries market. This is so important for the financial markets worldwide.’” April 23 – Bloomberg (Jana Randow, Mark Schroers and Lisa Abramowicz)


This helps us understand the fact that global bond markets are signaling a new paradigm of market yields increasingly disconnected from central bank policy rates. This has been notably since the Fed’s rate cutting cycle last year, long before Trump. Loose monetary policies are no longer automatically transmitted to lower bond yields. There are multiple reasons here; surging bond issuance, mounting debt levels, and structurally elevated inflation risk via tariffs, though this has not come to the fore yet (and may not).
Central Banks are NOT Controlling Yields
What should be clear by now the Fed is not in control of the monetary inflation process. Indeed the QE experiment means the Fed has for decades accommodated history’s greatest Bubbles, with that come unprecedented leveraged speculation.
It is not just the Fed,
- The ECB has cut rates 100 bps so far this year (to 2.15%), German yields have jumped 36 bps y-t-d.
- The Bank of England policy rate was reduced 50 bps (4.25%), though gilt yields are up five bps.
- The Bank of Canada has cut 50 bps (2.75%), and 10-year yields rose 28 bps.
- The Reserve Bank of Australia has reduced rates 50 bps (3.85%), with 10-year yields down only four bps.
- Japanese yields have surged 42 bps so far in 2025, after a 25 bps increase in the policy rate.
Inflate or deflate, Bubble dynamics will and have dictated the course of Federal Reserve policies. It would seem the Fed’s balance sheet is the only option for stabilizing system liquidity in the event of major speculative deleveraging. Though we have been hearing that since the 2008 bailout, the Fed for their part appears to whistle past the grave during periods of speculative excess and the resulting marketplace liquidity flooding.
Highlights – Federal Reserve
- Federal Reserve Credit increased $11.5 billion last week to $6.603 TN, with a 14-week expansion of $113 billion. Fed Credit was down $2.287 TN from the June 22, 2022, peak. Since the September 11, 2019 restart of QE, Fed Credit has expanded $2.876 TN, or 77%. Fed Credit inflated $3.792 TN, or 135%, since November 7, 2012 (697 weeks).
- Fed holdings for foreign owners of Treasury, Agency Debt dropped $21.0 billion last week to $3.025 TN – the low back to January 2012.
- “Custody holdings” were down $279 billion y-o-y, or 8.4%.
- Updated 3/20/26
Highlights – Mortgage Market
- Freddie Mac 30-year fixed mortgage rates jumped 11 bps to 6.22% (down 45bps y-o-y).
- Fifteen-year rates increased four bps to 5.54% (down 29bps).
- Bankrate’s survey of jumbo mortgage borrowing costs had the 30-year fixed rate down four bps to 6.41% (down 41bps).
- Updated 3/20/25
Fannie Mac & Mae IPO’s
Through all the speculation, the doubling of share prices and the hit on prices with the crypto crash late last year the latest directive from President Trump means Fannie Mae is now unlikely to be privatized. The directive of President Donald Trump for Fannie Mae and Freddie Mac to buy $200 billion worth of mortgage securities seemingly leads the two entities not going public again in massive initial public offerings.
Trump’s social-media post implicitly suggested he wants to keep the pair under the conservatorship they’ve been in since the global financial crisis of 2008-09.
“Because I chose not to sell Fannie Mae and Freddie Mac in my First Term, a truly great decision, and against the advice of the ‘experts’ it is now worth many times that amount – AN ABSOLUTE FORTUNE – and has $200 BILLION DOLLARS IN CASH. Because of this, I am instructing my Representatives to BUY $200 BILLION DOLLARS IN MORTGAGE BONDS,” he wrote.
January 9 “US President Donald Trump is directing Fannie Mae and Freddie Mac to purchase $200 billion in mortgage bonds, a move he cast as his latest effort to bring down housing costs ahead of the November midterm election. Trump announced the move…, saying ‘This will drive Mortgage Rates DOWN, monthly payments DOWN, and make the cost of owning a home more affordable.’ He added that his decision not to sell Fannie Mae and Freddie Mac during his first term allowed them to amass ‘$200 BILLION DOLLARS IN CASH’ and that he was making his announcement ‘because of that’.” – Bloomberg (Josh Wingrove, Scott Carpenter and Katy O’Donnell)
Evercore ISI analysts led by Matthew Aks however there is hope for an IPO yet.
“Trump could still at some point opt to (1) forgive the government’s senior preferred stake in the entities, deeming it repaid based on capital returned to the government under the controversial net worth sweep; and (2) re-list the entities on the [New York Stock Exchange],” the analysts said.
Fannie Mae (FNMA) has a market cap of about $13 billion. Freddie Mac (FMCC) is worth about $7 billion. The actions would lead to a significant appreciation in the book value of the equity held by private shareholders and create a more liquid market for the entities’ common stock – both of which trade on the over-the-counter market – without causing any real disruption to the government-sponsored enterprises’ operations or the housing market, the analysts said. Doing so would move the GSEs closer to privatization and allow Trump to claim progress on the issue.
“There would also be some who say that deeming the senior preferred stock repaid gives a windfall to private shareholders at the expense of the taxpayer. But we don’t think Trump would be particularly bothered by this, and he would certainly have ways to respond, including by underscoring that this was a necessary first step to unlocking long-term value for the taxpayer,” the analysts said.
Background:
Update November 21: From their September 12th highs (15.99 and 14.99) to November 21, the stocks of Fannie Mae and Freddie Mac have both dropped 47%. From its October 6th high to Friday’s intraday low (80,554), bitcoin has collapsed 36%. Bitcoin slumped 10.4% this week.
Ackman’s Pershing Square Capital reportedly holds a combined 215 million Fannie and Freddie shares. Ackman and others believed they were poised to make billions from the administration’s privatization of these two GSEs, which have been in federal receivership since the Great Financial Crisis. A big score on Fannie and Freddie shares would work wonders for Ackman’s 2026 Pershing Square IPO plans.
- “Bill Ackman says ‘forced liquidations and margin calls in crypto’ are leading to selling of Fannie Mae and Freddie Mac shares. ‘I underestimated how much exposure Fannie and Freddie (‘F2’) have to crypto, not on balance sheet, but in their shareholder bases,’ Ackman says… ‘We don’t own bitcoin, but clearly in the short term, we own a stock market proxy for bitcoin’.” November 21 – Bloomberg (By Jim Silver):
- “Billionaire Bill Ackman said now isn’t the right time for the Treasury to sell its shares of the government-sponsored mortgage giants known as Fannie Mae and Freddie Mac. The Pershing Square Capital Management founder held a presentation on X Tuesday that said it ‘will take significant time’ for the government to ‘deliberately execute’ an initial public offering of its shares of Federal National Mortgage Association and Federal Home Loan Mortgage Corp… Ackman said there are a few steps that should be taken before the government sells its shares because it will take some time to get buy-in from market participants…” November 18 – Bloomberg (Katherine Burton):
Background: President Trump working on taking Fannie Mae and Freddie Mac public, “want to be clear, the U.S. government will keep its implicit guarantees” via Truth Social May 27. On August 8 Fannie Mae and Freddie Mac soared after the Wall Street Journal said Trump is preparing initial public offerings for each of the agencies as early as this year. The sales could raise around $30 billion and value the firms at roughly $500 billion or more together, the WSJ reported.
The Fed is effectively throwing additional fuel on historic speculative manias. Central banks have been adding liquidity to avoid systematic failure.
Highlights – European Bonds
- Italian 10-year yields surged another 18 bps to 3.96% (up 41bps y-t-d).
- Greek 10-year yields jumped 16 bps to 3.94% (up 50bps).
- Spain’s 10-year yields gained eight bps to 3.58% (up 29bps).
- German bund yields increased six bps to 3.04% (up 19bps).
- French yields rose eight bps to 3.76% (up 19bps).
- The French to German 10-year bond spread widened about two to 72 bps.
- U.K. 10-year gilt yields surged 17 bps to 4.99% (up 52bps).
- Updated 3/20/26


Highlights – Asian Bonds
- Japan’s 10-year “JGB” yields added two bps to 2.28% (up 21bps y-t-d).
- Yields sit over 2.02%, the high all the way back to February 17, 1999. Interestingly Japan’s government debt-to-GDP ratio surged from 130% in 1999 to 221% (3/31/25). Curiously, the yen has been sinking versus the dollar.
- Updated 3/20/26
Japan’s latest Bond route – Jan 20 2026
- Thirty-year JGB yields surged 27 bps in wild Tuesday trading, to 3.85%, before reversing lower to end the week up 14 bps at 3.60%.
- After trading Tuesday to the highest level since September 1997, 10-year JGB yields closed the week seven bps higher to 2.26% (up 19bps y-t-d).
Contagion Impact: When JGBs falter the old bond vigilante fears set in
- Ten-year Treasury yields rose to a five-month high 4.30% in Tuesday trading (up 30bps from late-November lows).
- Greek yields surged 18 bps in two sessions to 3.52%, the high back to April’s “liberation day” instability.
- German (10yr) yields rose seven bps this week to 2.91%, a more than two-year high, and within only five bps of the highest yield since July 2011.
- Swedish yields added five bps to 2.92%, within two basis points of highs since 2011.
- Australian yields jumped 11 bps to 4.82%, only a couple bps from highs back to 2011.
- New Zealand 10-year yields surged 15 bps to 4.59%.
- UK 10-year gilt yields jumped 11 bps this week to 4.51%.
“The selling in Japan’s $7.6 trillion bond market began slowly, then seemed to hit all at once. What started as an unremarkable day on Tokyo trading desks quickly morphed into what several market participants described as the most chaotic session in recent memory. While concerns about Japan‘s fiscal position had been simmering for weeks, they suddenly boiled over on Tuesday afternoon with little warning — sending yields on some bonds to all-time highs. The rout left some hedge funds rushing to unwind losing trades, pushed life insurers to dump bonds and caused at least one corporate bond investor to pull out of a multi-million dollar deal. Even as traders struggled to pinpoint an immediate catalyst for the selloff, the overriding worry was clear: Prime Minister Sanae Takaichi’s plans to cut taxes and boost spending are raising doubts about the financial health of one of the world’s most indebted governments. ‘This is basically the market pricing in a Liz Truss moment in Japan,’ said Masahiko Loo, senior fixed-income strategist at State Street Investment Management.” January 20 – Bloomberg (Ruth Carson, Taiga Uranaka, Lisa Du, and Finbarr Flynn):
Sanae Takaichi and JGBs following in the footsteps of Liz Truss and the gilts market from 2022? That’s one major predicament for Japan – and markets across the globe. At upwards of $13 TN, outstanding Japanese government debt is about three-times the size of the UK’s. Weighing in around 250% of GDP – and almost half owned by the BOJ – a Japanese bond crisis has unbelievable possibilities.
Thirty-year JGB yields surged 27 bps in wild Tuesday trading, to 3.85%, before reversing lower to end the week up 14 bps at 3.60%. After trading Tuesday to the highest level since September 1997, 10-year JGB yields closed the week seven bps higher to 2.26% (up 19bps y-t-d).
Ten-year Treasury yields rose to a five-month high 4.30% in Tuesday trading (up 30bps from late-November lows). When JGBs falter, it’s curious to watch the old bond vigilante fears set in. Greek yields surged 18 bps in two sessions to 3.52%, the high back to April’s “liberation day” instability. Interestingly, German (10yr) yields rose seven bps this week to 2.91%, a more than two-year high, and within only five bps of the highest yield since July 2011. Swedish yields added five bps to 2.92%, within two basis points of highs since 2011. Australian yields jumped 11 bps to 4.82%, only a couple bps from highs back to 2011. New Zealand 10-year yields surged 15 bps to 4.59%. Worryingly, UK 10-year gilt yields jumped 11 bps this week to 4.51%.

Background: “Japanese government bonds tumbled on Wednesday, sending benchmark yields to near 17-year highs, as traders priced in increased political risks and a hazy outlook for the central bank’s policy normalisation path. In a sign of how nervous markets are, the Ministry of Finance’s first sale of super-long government debt since a bruising electoral defeat for Prime Minister Shigeru Ishiba logged the weakest demand in almost 14 years… The 10-year JGB yield jumped as much as 10 bps to 1.6%, marking its biggest move in months and the highest level since October 2008. Super-long term JGB yields hit record highs in May and are back near those levels… ‘We’re seeing a possible buyers’ strike playing through,’ said Chris Weston, head of research at broker Pepperstone.” July 23 – Reuters (Rocky Swift and Gregor Hunter):

Key Note: Back on the 9/19/25 BOJ meeting yields took another leg up, short-term JGB yields leap to highest since 2008 after BOJ dissents lead to repricing in next BOJ rate hike, 2-yr JGB yields up to 0.91% 5-yr JGB yields up to 1.20% Both bonds highest since 2008. NB: Very rare to see BOJ policymakers break rank.
Quietly, China is pumping out record quantities of (globally impactful) Credit.
“The balance sheet of China’s central bank is bigger than ever before, in dollar terms. In contrast, those of the Fed, ECB and BOJ have all reduced by trillions of dollars since their pandemic peaks. As of the end of August, the Fed’s balance sheet was $6.6 trillion, having fallen $40 billion from the prior month. The equivalent figures for the PBOC are $6.5 trillion, after a $120 billion increase. Assume the same rates of change again this month, the PBOC will overtake its American rival for the first time since March 2020.” September 16 – Bloomberg (Mark Cudmore)
“A selloff in China’s bond market is accelerating, sending futures on ultra-long debt to a four-month low as a bull run in local stocks builds momentum. Futures on 30-year sovereign notes fell as much as 0.7% Thursday, extending this week’s drop to 1.5% at the low as a gauge of onshore equities reached its highest point since October.” August 13 – Bloomberg (Julia Zhong and Shulun Huang)
China’s state-directed banks increased total assets $1.915 TN during Q1 to a record $63.920 TN, the strongest growth in two years. This pushed one-year growth to over $4.0 TN, or 6.7%.
- Aggregate Financing, China’s metric for system Credit, expanded a stronger-than-expected $586 billion during June, up from May’s $319 billion and June ‘24’s $460 billion. First-half growth of $3.185 TN was up 26% from comparable 2024. Record one-year growth of $5.159 TN exceeds even pandemic 2020’s $4.852 TN. Historic Credit expansion belies all the China deflation talk.
- Corporate Loan growth of $246 billion (up 8.9% y-o-y) was up from May’s $75 billion and June ‘24’s $227 billion, with first-half growth of $1.608 TN up 5% from comparable 2024. Consumer Loans increased $83 billion (up 3.0% y-o-y), up from May’s $8 billion and June ‘24’s $80 billion. Government Bonds surged $188 billion for the month, easily surpassing June ‘24’s $119 billion. Year-to-date growth of $1.067 TN more than doubled comparable 2024. Record one-year growth of $2.177 TN compares to pandemic 2020’s $1.162 TN.
Junk Bond Market Euphoria
Financial conditions have loosened dramatically since April’s market tumult.
“US leveraged-loan issuance skyrocketed in July as junk-rated borrowers flocked to the market largely to reprice debt, saving companies millions in interest expenses. July set a fresh record with $222.2 billion in loans launched, surpassing the prior $206.7 billion high set in January, according to data compiled by Bloomberg. During the month, more than 180 new leveraged-loan tranches came through the market, the data showed.” BBG

July 21 – Bloomberg (Rachel Graf): “About $61 billion of US leveraged loans hit the market Monday, the second-most ever…, as junk-rated borrowers continue rushing to lower borrowing costs by repricing existing loans. There were 33 launches…, with all but six of them repricings. The largest was a $7.57 billion offering for medical supplies giant Medline, the bulk of which will be used to reprice a term loan.”
July 25 – Bloomberg (Gowri Gurumurthy): “US junk bonds are headed for their second week of gains after steadily rising for six straight sessions… The broad gains were… partly fueled by large cash inflows into US high yield funds in 11 of the past 12 weeks. The funds reported a cash haul of more than $900m for the week ended July 23… CCC yields, the riskiest tier of the junk bond market, dropped to a three-week low of 10.66% after steadily declining for four sessions. CCCs are on track to rack up their seventh week of gains, the longest streak since October… The market priced nearly $9bn in four sessions this week, making it the busiest week since mid-May. The month’s volume is $27.5b. This will be the busiest July since at least 2021.”
July 24 – The Bond Buyer (Jessica Lerner): “Fears about changes to the tax exemption, shifting macroeconomics, growing capital needs and inflation-induced added costs to complete projects… led state and local government issuers to bring debt at a record pace, with issuance already on track to break 2024’s record $500-plus billion. The volume currently stands at $310.166 billion, up 17.4% from $264.151 billion at the same time last year. Now that the second half is underway, several firms revisited their supply projections for the year…”
- After spiking to 453 bps, junk bond spreads sank 24 bps this week (4 sessions!) to 268 bps, the narrowest since February 20th.
- Investment-grade spreads narrowed eight to 77 bps, matching the low back to December 18th – and closed Thursday only three bps above multi-decade lows.
- Leveraged loan prices closed the week at highs since February 27th.
- Bank CDS prices have dropped back to March levels – at home and abroad. JPMorgan CDS traded back down to 41.5 bps (April 9th high 71), the low since March 10th. At 99.25 bps,
- European (subordinated debt) Bank CDS are down from an April 7th 169 bps high – to the lowest level since March 5th.
July 4 – Bloomberg (Gowri Gurumurthy): “US junk bonds racked up gains for the 10th straight session as investors poured cash into the asset class… Yields hit a nine-month low of 6.99%… US high-yield funds took a cash haul of $3.5b for week ended June 25, the largest weekly inflow in 18 months. It was the ninth consecutive week of cash flows into these funds… The market has already priced $6.6b in just three sessions this week after a flurry of issuance in June made it the busiest month since September 2021.”
July 1 – Financial Times (Euan Healy): “Sales of risky European corporate debt surged to their highest ever level in June, as lowly rated companies take advantage of a capital flight out of US markets… Issuance by high-yield, or junk-rated, companies — many of which have previously struggled to access the market — rose to about €23bn in June, according to JPMorgan… That beats the previous monthly record, set in June 2021, by roughly €5bn. June also saw the greatest number of deals on record at 44… ‘The market is drowning in new deals,’ said an investor at a European credit hedge fund.”
Part C: Commodities
Highlights This Week
- The Bloomberg Commodities Index slipped 0.6% (up 22.3% y-t-d).
- Spot Gold dropped 10.5% to $4,492 (up 4.0%). Silver sank 15.7% to $67.945 (down 5.2%).
- WTI Crude slipped 48 cents, or 0.5%, to $98.23 (up 71%).
- Gasoline jumped another 8.0% (up 92%),
- Natural Gas declined 1.1% to $3.095 (down 16%).
- Copper lost 6.6% (down 5%).
- Wheat dropped 3.8% (up 17%),
- Corn rose 2.9% (up 6%).
- Bitcoin was little changed at $70,539 (down 19.5%).


Baltic Exchange’s Dry Bulk Index (BDI)
- The Baltic Exchange’s dry bulk index, which tracks rates for vessels transporting dry commodities, fell slightly for a second session on Friday, down about 0.1% to 2,056 points. The benchmark index logged a 1.4% weekly gain.
- The panamax index, which usually carry 60,000 to 70,000 tons of coal or grain, decreased about 0.3% to 1,904 points;
- The capesize index, which typically transport 150,000-ton cargoes including iron ore and coal, rose by 0.2% to 2,971 points.
- The supramax index fell by 0.4% to 1,224 points.
- Source: Baltic Exchange 3/20/26

Agriculture Futures


Cocoa
Cocoa prices are hovering near the lowest since January 2024, amid lingering concerns over demand. Dealers cited weak global demand that is leading to a build-up in stocks of unsold beans in both the Ivory Coast and Ghana, the world’s two largest producers.
Cocoa futures fell -12.58% in the first week of 2026 a long way from being the best performing in 2024, surging by 176% for that year. Since then, we have had a vicious pullback. of over a 1/2 or $7,000. Cocoa a great example of how controlled or limited surplus can determine price. Africa produces 60% of global cocoa and nearly half of the world’s cocoa comes from just two West African countries, Côte d’Ivoire and Ghana.

The Ivory Coast officially launched on January 29, 2026, a strategic operation to buy back thousands of tons of unsold cocoa that have been sitting in warehouses and around the country’s ports since November 2025. The Ghana Cocoa Board (COCOBOD) has disclosed that buyers on the international market are increasingly turning away from Ghana’s cocoa due to higher prices compared to beans from other producing countries. Ghana has about 50,000 metric tons of unsold cocoa sitting at its ports. On the supply side, the outlook remains favorable. StoneX recently projected a global surplus of 287,000 tons for the 2025/26 crop year and 267,000 tons for 2026/27.
The surge in 2024 cocoa prices was due to political and weather disruptions in West Africa. The crops were already struggling thanks to underinvestment in cocoa farms with growers struggling to replant diseased trees.
Coffee
Arabica coffee futures fell to 294 USd/Lbs on February 6, 2026, down 4.67% from the previous day. Over the past month, Coffee’s price has fallen 21.69% and is down 28.60% compared to the same time last year, according to trading on a contract for difference (CFD) that tracks the benchmark market for this commodity. Prices influenced by the ongoing Brazilian real’s relative strength tends to discourage export sales by Brazil’s coffee producers. Dealers also noted that the drop in Brazilian grain exports in 2025 continued to weigh on prices.

Coffee futures followed cocoa lower in the first week of 2026. after following it higher through 2024 to be up 73% for 2024, reaching a 47-year high as markets grappled with persistent supply concerns in key growing regions. While it has corrected off those highs in 2025 it was still up over 10%, whilst cocoa fell 50%. The premium bean, arabica futures price doubling in 2024. Extreme weather in Brazil and Vietnam affected supply whilst demand was pressured by booming demand in markets like China.
Orange Juice OJ
Orange Juice futures fell -5.65% in the first week of 2026, after falling 60% in 2025. It gave up the whole 2022 to 2025 rally in the last quarter of 2025.

Live Cattle
Live Cattle rose to 237.40 USd/Lbs on February 6, 2026, up 0.91% from the previous day. Over the past month, Live Cattle’s price has risen 1.23% and is up 18.27% compared to the same time last year, according to trading on a contract for difference (CFD) that tracks the benchmark market for this commodity.

Lumber
Lumber futures fell toward $590 per thousand board feet, retreating from its three-month high of $614.5 on January 20th as US housing data weakened and earlier restocking flows faded. Pending home sales plunged 9.3% month on month in December, the sharpest drop since April 2020, signaling softer transaction activity and tempering expectations for near-term construction demand ahead of the spring building season. Physical markets also cooled, with distributors reporting quieter order books even as mills continued running at steady rates to rebuild inventories after earlier tightness, briefly loosening availability. At the same time, longer term supply growth remains constrained by ongoing tariffs on Canadian softwood and slower capacity expansion across North American sawmills, limiting surplus.

Metals

Copper
Copper fell to around $5.77 per pound Friday, lowest level in nearly six weeks, and on track for its worst week since late November, pressured by slowing demand from Chinese buyers and rising inventories. Reports showed that key consumer China had reduced purchases by fabricators and manufacturers as firms gradually pulled back ahead of the Chinese holidays.
Stockpiles in LME warehouses across Asia are also climbing, further signaling softer demand. Analysts say the trend could accelerate as traders divert shipments from Africa to China to take advantage of temporary price gaps between Shanghai and London. Market sentiment was further weighed down after the China Nonferrous Metals Industry Association projected that refined copper output will rise about 5% in 2026, half the growth recorded in 2025.

Copper is the bellwether industrial metal, even more so in 2026 driven by the energy transition and the booming artificial intelligence sector’s demand for it. This adds to supply risks and hopes for global recovery in demand. Disruptions in 2025 were seen at major mines and Chinese plants which produce more than half of the world’s refined copper impact price. Mine closures and tariffs impacted prices as did the surge in silver prices, being a by product of copper mining driving copper futures prices to record highs in 2025.
S&P Global in a note on Jan 7, 2026 said “The world is on track for a copper shortage that would pose a ‘systemic risk’ to global economic growth, driven by the energy transition and the booming artificial intelligence sector’s demand for the red metal. The looming deficit is forecast to reach 10mn tonnes — equivalent to almost one-third of current global demand — by 2040, in the absence of a ‘meaningful expansion of supply’, said the data group… This constitutes a ‘systemic risk for global industries, technological advancement and economic growth “

2025 was a volatile year for Copper, a reminder of commodity risk goes both ways:
- “U.S. copper futures plunged roughly 20% in late trading Wednesday after President Trump unveiled 50% tariffs on copper products but not on the raw material itself. It is the latest example of how Trump’s gyrating trade policies have whipsawed financial markets… U.S. copper prices surged to records and well above global prices this month after Trump said he would impose a 50% import tax on the metal…” July 30 – Wall Street Journal (Ryan Dezember)
- “The world’s top commodity traders are rushing to ship copper to the US from as far afield as Asia as Donald Trump’s threat of import tariffs on the metal creates a huge opportunity for profit. The gap between copper prices in the US and the rest of the world widened sharply after the president… ordered the Commerce Department to examine potential levies on the metal. On Wednesday, prices on New York’s Comex surged as much as 4.9% to trade more than $1,000 a ton above the London Metal Exchange benchmark, which rose 1.2% to about $9,500 a ton.” February 26 – Bloomberg (Alfred Cang, Archie Hunter and Mark Burton)
Gold
Gold rose toward $5,030 on Friday, extending its rebound and paring weekly losses after Thursday’s more than 3% slide, as softer-than-expected US inflation eased pressure on Treasury yields and weighed on the dollar. The prior drop came amid a broad cross-asset selloff that forced investors to liquidate precious metals to raise cash, with simultaneous declines in equities and cryptocurrencies underscoring a wider risk-off move after a week of sharp two-way moves. The rebound followed a late January liquidation wave triggered by higher margin requirements and a steep selloff in silver that spilled across precious metals, pushing prices lower before buyers reentered.
Gold rush to record highs was supported by safe haven buying, Russia and China buying to avoid sanctions also pushed it higher last year. The price rose against multiple currencies, including the U.S. dollar. The structural driver is higher demand from central banks, while a cyclical lift came from flows to exchange-traded funds as the Federal Reserve cut rates.


Silver
Silver extended its rebound toward $78 per ounce on Friday, halting the selloff that started late January after reaching a record of $121 on January 29th, after a wave of selling triggered higher margin requirements and magnified liquidation.
Silver surged to record highs in 2025 as surging demand for safe-haven assets exacerbated supply constraints in the London bullion market. It broke the highs since a notorious squeeze orchestrated by the billionaire Hunt brothers in 1980. Silver surged well beyond that to be up more than 165% for the year. It joined gold and the Swiss Franc as safe haven assets sparked by fears of fiscal risks in the US, an overheating equities market and threats to the Federal Reserve’s independence.


Platinum
Platinum futures fell below $2,100 an ounce, retreating after a recent rebound, tracking a broader precious metal sell-off amid a rising US dollar. Platinum joined the precious metal rally, late but nevertheless to record highs in 2025 as the years-long supply crunch in platinum came to a head forcing banks to scramble in London as buyers in China and the US aggressively bought up the stocks.
The market tightness made platinum one of the best-performing commodities in 2025 and fueled sky-high borrowing costs for the precious metal. Tariff fears funneled large volumes to US warehouses, while Chinese imports continue to exceed estimated domestic consumption.


Energy


Oil Questions for 2026
- Oil prices in 2025, like in 2024 traded in a relatively stable range given the world conflicts in energy supply related regions. The two years have seen the narrowest trading range since 2019. Adjusting for inflation, 2024 was the narrowest since 2003. A moribund world economy working against Middle East and Russian tensions. The US economy however has suprised to the upside and Germany just went out of contraction.
- The US move on Venezuela in the first week of 2026 helps answer one of 2025’s big questions, why China is stockpiling so much oil. China got much of it’s cheap oil from Venezuela. China purchased over 150 million barrels above its actual use by Q3 2025 Bloomberg reported. Chinese officials have long worried that the U.S. and its allies could hamstring the nation’s economy by choking off its supply of foreign oil.
- China has been relentlessly moving towards electric vehicles designed and produced locally to not be caught hostage to foreign oil.
- U.S. energy companies played the smart card pushing production higher familiar with the cycle of oil prices. Natural gas demand grew as did record U.S. production, we saw increased electricity consumption, driven by the AI mania.
- President Trump’s relentless push for lower oil prices has consequences for the oil industry, R&D namely which can have distrastorus effects in the future for oil supplies, the old adages higher oil prices begets higher oil prices.
- We have the simmering of an Iranian uprising in the first week of 2026 to addanother question to the oil matrix.
A reminder the analyst narrative before the Iran war was that not much damage and it would be temporary. Oil was the most hated commodity, there were big shorts out there of Oil, LNG, NG futures and energy related names. All this added fuel to that sharp pop in oil, TTF and LNG futures. Another example of where ‘they’ got it all wrong. Recall oil futures and stocks were going u and had bottomed before the US and Israel bombing of Iran/
Oil and Iran


US Crude Oil (WTI)
WTI crude oil futures rose more than 2% to about $60.8 per barrel Friday, extending gains for a fifth straight week supported by geopolitical and supply risks. The move followed renewed warnings from US President Donald Trump toward Iran, raising concerns over potential military action that could disrupt oil flows. The dollar slid toward its worst week in seven months, making crude cheaper for non-US buyers amid strained US-Europe relations and unresolved Ukraine peace talks. However, gains remain capped by expectations of oversupply, with the IEA projecting global stockpiles to rise by 3.7 million bpd this year.

Daily: The market has behaved as expected as we have said being in a completive mode for bulls with the upside impulse, it was a question of degree on the topside, as it will be on the downside. Use the Murrey math 240/60 grid. Was oil completing a C or IV? Support is previous lows and the bull flag. The bear case is the high was a complete 5.

Weekly: WTI crude oil futures held the support line from July 2021, having plunged around 50% off 2022 highs. The market is now back testing it. The break to the topside of its sphere of influence over Kijun and Tenkan failed, and which are now resistance. Risk support is the grid. Resistance weekly channel, Murrey Math levels and previous breaks (off monthly). Bear case is Wave 5 complete.
The key is crowd behavior to help tell the story which in energy is often around geopolitics. A great example of why we watch ABC corrections and from here we get the energy from the break being balanced. This move that was powered by 50 dma Tenkan spit of a spit – hence the fractal energies reverberations.
In China, the refining industry is at a “crossroads as demand approaches its peak,” with 840K b/d of capacity at risk of closing before the end of 2028, according to BMI. Most of the expected reduction in capacity is likely to come from state-owned refiners, although independent processors are also under pressure.

via BloombergNEF tracking of more than 60 assets around the globe.
US Natural Gas (Henry Hub)
US natural gas futures are up more than 65% since the start of the week, the largest weekly gain on record, driven by forecasts for widespread below-normal temperatures across most of the country, as the market continued to brace for a historic winter storm. The severe freeze, especially in southern gas-producing regions, has raised concerns about ice forming in pipelines, which could disrupt production and exports.
Daily: US Natural Gas futures are a great example of rebalancing mania. The market until this week had been correcting the manic 5 post the Ukraine invasion and beyond. Since the breakdown of the correction channel with failed breakups, we had continued to multi year lows in a pennant formation after holding the daily 1/8. We look at our Adam’s theory fractal rules with fractal spits powering these moves lower and boom we got extreme breakdown off the lows the prior Friday. Natural gas futures notorious for the maekrt getting all one way & trapping players.

Two clear alternatives, we are correcting the highs 5 or that was a 3 and we go higher. Resistance is heavy: 2/8 and cloud above. Kijun, 50 dma and cloud. Support is previous lows. Important to watch how this energy was built for shape correlation.
Like the larger wave on the way up it accelerated through previous highs (flat topped triangle energy) and over the resistance at 8/8 and new highs. We successfully tested that break in a pennant ABC. Previous highs (flat topped triangle energy) and 8/8 and new highs underscore the structure that fed the move and is key longer term in the collapse lower.

Weekly: Natural gas has been busy correcting the past months when it blew through all levels of support after breaking the weekly 50wma and the Kijun gave a kiss of death. That rinse allowed the setup for this week’s violent reaction BUT still inside the year long channel. From there we formed an island reversal which has resolved to the topside, trapping shorts and bears. Recall it broke down out of the corrective channel (Wave 4 or IV) to new multi-year lows.
The instability and volatility stem from the sharp reversals that have failed indicative of speculative fervor like the previous impulsive spikes. Support is the flat Kijun and Tenkans. Resistance the near highs and previous uptrend. Bears need all the damage down to be rebuilt. Kijun became the accelerator given energy lower and now higher came from a clean break of the Kijun
Dutch TTF Futures (EU Benchmark)

Part D: Forex Markets
John Maynard Keynes, 1920: “There is no subtler, no surer means of overturning the existing basis of society than to debauch the currency. The process engages all the hidden forces of economic law on the side of destruction and does it in a manner which not one man in a million is able to diagnose.”
- For the week ended March 20, the U.S. Dollar Index slipped 0.7% to 99.647 (up 1.3% y-t-d)
- On the upside, the Norwegian krone increased 2.1%, the Swedish krona 1.5%, the euro 1.4%, the New Zealand dollar 1.0%, the British pound 0.8%, the Australian dollar 0.6%, the Swiss franc 0.4%, the Japanese yen 0.3%, the Mexican peso 0.3%, the Brazilian real 0.2%, and the Singapore dollar 0.1%.
- On the downside, the South African rand declined 0.6%, and the South Korean won slipped 0.4%. China’s (offshore) renminbi was unchanged versus the dollar (up 1.22% y-t-d).

The Dollar from Flex to Sell
“The US dollar had its worst start to the year since 1973, as Donald Trump’s trade and economic policies prompt global investors to rethink their exposure to the world’s dominant currency. The dollar index… tumbled 10.8% in the first six months of 2025, the worst start to the year since the end of the gold-backed Bretton Woods system. ‘The dollar has become the whipping boy of Trump 2.0’s erratic policies,’ said Francesco Pesole, an FX strategist at ING.” – June 30 – Financial Times (Ian Smith)

June 23 – Reuters (Yoruk Bahceli and Dhara Ranasinghe): “The custodians of trillions of dollars of global central bank reserves are eyeing a move away from the greenback into gold, the euro and China’s yuan as the splintering of world trade and geopolitical upheaval spark a rethink of financial flows. The survey of 75 central banks… gives a first snapshot of the repercussions of U.S. President Donald Trump’s April 2 Liberation Day tariffs that sparked market turmoil and a slide in the safe-haven dollar and U.S. Treasuries. Gold, which central banks have already been adding at a record pace, was seen benefiting even further longer term, with a net 40% of central banks planning to increase gold holdings over the next decade. ‘After years of record-high central bank gold purchases, reserve managers are doubling down on the precious metal,’ OMFIF said.”
May 20 – Reuters (Saqib Iqbal Ahmed and Laura Matthews) “Trade-related uncertainties, ballooning fiscal debt and weakened confidence about enduring U.S. exceptionalism have weighed on U.S. assets, with the dollar one casualty. Investors see the currency losing more of its luster as the greenback comes back to earth from lofty valuations. The Trump administration’s tariffs salvo this year prompted investors to cut exposure to U.S. assets after a long period of overperformance… ‘There’s plenty of room for further depreciation, purely from a valuation perspective,’ said George Vessey, lead FX and macro strategist at payments firm Convera. The ‘sell America’ trade was back in focus after Moody’s U.S. credit downgrade, he said.”
The Carry Trade Returns
Where is all this liquidity coming from fueling this one asks. Well simple really and a reminder of why we watch the carry trade so intently. With greed overshadowing risk and again why breakeven or break up tests are so important, again look at our notes on the stock indices, bitcoin and forex, even gold. The index of carry returns hit a seven-year high in late May Bloomerg reported. Asset managers boosted long positions in developing-nation currencies in recent weeks, our ols favorite Mexico peso reaching a nine-month high. Other, riskier EM carry trades have been the Chilean peso and South Korean won in this run.

The move has coincided with the collapse of the VIX, the strategy performs best in periods of low volatility. JPMorgan Chase’ ‘s gauge of global currency volatility dropped to 8.7% on Friday from as high as 11% in early April. Recall the swoon last year in August with most carry trades funded in the ultra-low-yielding yen being wrecked after the Bank of Japan interest-rate hike that triggered a surge in the yen and with-it losses on the currency, forwards spreads. This was well telegraphed and a reminder to be proactive not reactive and note when scenarios have run their course risk wise. Expect the unexpected.
Another big fillip was NVIDIA’s (NVDA) better-than-expected earnings report and outlook after Wednesday’s close. It should be noted that in a somewhat amazing mis report from NVDA where it was initially reported as a miss at .81 EPS and then corrected to .96 EPS, after there was heavy selling and causing shorts to cover and rebuy added to the strength, Intentional, doubtful but the price affect real. You could argue the same on the tariff on and off effect on trade. Squeeze the shorts, buy the dips like with intent. There was more sources of strength came from stronger 2-yr, 5-yr, and 7-yr note Treasury auctions, improved consumer confidence, and some confusing action on the tariff/trade front.
Talking about tariff on and off market affects; on Wednesday, the U.S. Court of International Trade ruled that the president did not have the legal authority to enforce reciprocal tariffs. On Thursday, the U.S. Court of Appeals granted the White House’s request to temporarily reinstate the tariffs. On Friday, President Trump said China had violated the preliminary trade agreement worked out in Switzerland and noted “So much for being MR. NICE GUY!” before adding later that day that he hopes to be able to work things out with President Xi.
The carry trade in less liquid currency brings risk, as alpha strategy do, currency risk is real. Remeber all the punters that bought the Turkish Lira? The Taiwan dollar surged early May as currency gains saw a stampede to exit positions using it as a funding currency. The Hong Kong dollar back tested the weak end of its trading band in late May as falling local interest rates helped traders to use the currency as a funding vehicle Bloomberg reported. The trade war and the PBOC talking of more easing monetary-policy further in China is seeing the yuan becoming an attractive funding currency,

With inflation falling back with growth falling after high interest rates in many emerging-market economies real yields on their bonds are relatively attractive. Don’t forget the currency risk, see above! Brazil’s real features is being pushed by as an attractive longs at investment banks such as Goldman Sachs Group and ING Groep NV. Something to remeber the BRL fell to record lows earlier in the year against the US dollar and recovered from record support from Brazil’s central bank.
Extraordinary late-cycle resilience is only fitting of history’s greatest Bubble. Explanations include Credit system might that comes from steadfast $2 TN or so of annual federal debt growth – the reckless expansion of money-like Treasury debt. What’s more, Trillions of Treasury/Agency market speculative leverage create a hardier market structure than, say, levered positions in more suspect corporate debt or risky mortgages. And it’s worth noting the recent comments of the robustness of private Credit and private markets more generally.
Key Currencies Versus the US Dollar
Australian Dollar
“The Australian dollar, Norwegian krone and New Zealand dollar have surged ahead of other major currencies this year, as foreign exchange markets point to a change in the direction of global interest rates from cuts to rises. The Aussie has gained more than 6% against the US dollar this year, taking it to around a three-year high, as the Reserve Bank of Australia this month kicked off what many analysts expect to be a new cycle of rate increases in response to a burst of inflation… The New Zealand dollar has jumped 4% as traders anticipate the country’s first rate rise in the coming months, while the krone is up 6% as an unexpected increase in inflation last month led traders to price in a small chance of a rate increase in the first half of the year.” February 24 – Financial Times (Ian Smith, Kate Duguid and Nic Fildes)
Aussie Dollar – AUDUSD
The Australian dollar has recovered back and through last year’s breakdown. It has corrected off a 5-year low in the New Year after it continued lower after breaking a three-month low of US65.1¢ on news of a Donald Trump’s US election victory before rebounding to US66.51¢ on hopes of fresh China stimulus. From there it has worked its way up to over .7150 AUDUSD and to records highs against the yen AUDJPY.

The Aussie dollar had been correcting since completing a 5 at the psych 80 level to fall under the weekly cloud in emotive fashion. The Australian dollar fell to test of the August lows of 0.7106 with Omicron fears. When that double bottom support broke it retested the Murrey Math Levels. Resistance the Cloud, Tenkan and Kijun like many commodities. From there it has been a combination of a stronger US dollar, a collapsing Chinese economy & concerns over the US economy.

Aussie Yen AUDJPY

Japanese Yen – USDJPY
The Japanese Yen touched 155.68 against the USD, the highest since December 2025. The yen gyrated after Bank of Japan held its target rate at 0.75% as widely expected and by an 8–1 vote with one member voting for a 25bps hike. Markets reacted a touch hawkishly with more confidence in sustained progress on inflation compared to the deflation years. Short-term Japanese bond yields increased 3bps in 2s but rallied at the long end by about 4bps. Markets are leaning toward the next rate hike to be delivered at the June or July meetings.
USDJPY traded between 159.2 and 157.60 around Governor Ueda’s press conference. Verbal intevention from Finance Minister Katayama who noted “We’re always watching with a sense of urgency,” in reference to the yen’s volatility but did not comment on whether they intervened. A reminder however Yen depreciation has been part of why Japan’s economy has been fairly resilient to US tariffs as Governor Ueda put it last meeting and why Japan isnt really uncomfortable with the weaker yen.
The bigger issue here for the yen, and JGBs is, and which kept the BoJ relatively neutral, is the election campaign as PM Takaichi’s call for a vote on February 8th puts in play high uncertainty over the fiscal policy path that lies ahead.
Prime Minister Sanae Takaichi has signaled her desire for a slowdown in rate hikes. Takaichi’s plans to boost spending which is fueling the yen’s weakness. Notably, any intervention would risk depleting Japan’s foreign exchange reserves needed to help fund a US investment package to placate U.S. President Donald Trump. It’s worth noting that Japan’s government debt-to-GDP ratio surged from 130% in 1999 to 221% (3/31/25).

USDJPY is still consolidating in a two-year pennant formation from that 108.00 massive support for dollar-yen back and retest around 140. Pivoting 151/152 in 2025. Any change will come from the weekly Kijun. Use your USDJPY Murrey 7/8 8/8 grid for now. EURJPY AUDJPY will determine risk on/off.
Yen weakness provided key support to dollar melt-up dynamics with BOJ slow-motion “normalization” in a world of fast-moving dynamics. The dollar yen traded 160.17 this cycle, the first time above 160 since April 1990. The then BOJ Governor Kazuo Ueda on that move basically ceded the yen fragility issue to the Ministry of Finance (MOF), affirming it wasn’t in the BOJ’s purview. He conveyed little concern for yen weakness, while downplaying its inflationary impact. The market accordingly took the yen out to the woodshed. The yen closed the week less than 3% from July 2024’s multi-decade low (161.69) vs. the dollar (7/2/86), set during a period of yen devaluation following the September 1985 Plaza Accord.
Euro Yen EURJPY


Chinese Yuan – USDCNH
China has been battling a weak economy for years and has been flooding its economy with liquidity to no avail, the result, falling yields and a record low for the Yuan against the US dollar. From there they defended it heavily at a triple top to see it reverse to highs not seen since July 2024.
“Chinese companies are boosting hedges through foreign‑exchange derivatives, pushing outstanding forward contracts to record levels, as the yuan’s surge threatens to erode exporters’ overseas earnings. Net outstanding forward settlement contracts reached $107 billion at the end of February, the highest level since records began in 2010, according to… the State Administration of Foreign Exchange.” March 17 – Bloomberg
“The yuan surged to its strongest level since May 2023 after China was said to have asked banks to limit their holdings of US Treasuries. Any shift away from US sovereign debt reinforces a broader global trend of diversification away from the dollar. Such a move might accelerate the repatriation of capital into Chinese assets, providing a fundamental tailwind for the yuan… The latest move is adding momentum for the yuan, which is already the third-best-performing currency in Asia since the end of September with a gain of around 3%.” February 9 – Bloomberg (Tian Chen)
“Xi Jinping has called for the renminbi to become a global reserve currency, in some of his clearest comments on his ambitions for China’s currency as Beijing seeks to play a greater role in the international monetary system… China’s president said the country needed to build a ‘powerful currency’ that could be ‘widely used in international trade, investment and foreign exchange markets, and attain reserve currency status’.” February 1 – Financial Times

The Yuan has appreciated since the lows of late 2024/25 with tweaks to its capital controls and a vow to crack down on market disruption. The People’s Bank of China and other regulators pledged to strengthen their management of the foreign-exchange market, deal with any behavior that may disrupt the market and prevent the risk of a large move in the yuan. The PBOC adjusted its rules for cross-border flows allowing firms and financial institutions to borrow more from overseas, which may help increase capital inflows and support the yuan.
South Korean Won – USDKRW
The won nears the psychologically important 1,500 level, breached only during the global financial crisis and the Asian currency meltdown in 1997. The currency had slightly appreciated so far this year after tumbling since October 2024 by a cumulative 12% depreciation to the dollar both on domestic political developments and external concerns related to a less dovish Federal Reserve and trade policy risks. It had dropped to its weakest level in 15 years.

“In South Korea, calls for action to stem the won’s decline are getting louder by the day. On Thursday, the finance ministry warned of increased volatility and said it would take swift measures if needed, while the government eased FX rules to boost onshore dollar liquidity. Presidential policy chief Kim Yong-beom is set to hold an emergency meeting with seven conglomerates to discuss FX issues.” December 18 – Bloomberg (Tian Chen and Susie Kang)
Indian Rupee – USDINR
Indian Rupee hit a new record low, USDINR record high as US dollar rallied on safe haven demand with the Iran War. ~90% of India’s crude oil is imported with 55% from the Middle East. They have been getting cheap Russian oil but have agreed to adhere to sanctions on that pre the war.
Important to remember
- The Rupee has been on a bearish trend v USD.
- Even before the war markets were repricing rate cuts with stronger US data higher oil prices puts forward more pressure on inflation
- Yields supporting USD FX forwards, US PMI prices index highest level since 2022

Indonesia Rupiah – USDIDR

The Americas
The Canadian dollar and Mexican dollar weakened and retraced some since the mention of Trump tariffs on the two countries.
Canadian Dollar – USDCAD
The Canadian dollar appreciated toward 1.36 per US dollar reaching two-week highs amid a global trade pivot favoring Canada’s relative stability over US policy uncertainty. The Loonie climbed after the US Supreme Court struck down broad emergency tariffs. Although the White House responded with new Section 122 duties, these rules explicitly exempt trade-compliant goods from Canada. Canada also benefited from a recovery in oil prices toward $66 after progress stalled in nuclear talks. Investors are essentially treating the Loonie as a stable alternative in a messy North American trade environment.
With the BoC signaling current rates are appropriate and US-Iran tensions keeping the greenback firm on safe haven flows the Loonie had been facing resistance as it balances trade policy relief against diverging monetary paths. The Loonie had been in a steady downtrend since 2021, on yield pressures, weakening economic metrics and political uncertainty. The USDCAD hit a 3 year high in June and corrected that in 3 waves led by the AUD and NZD with oil price impacting direction from there the selling of the Loonie resumed. From there it broke the 2020 highs and tested 1.48 before reverting back on tariff gamesmanships in 2025.

Mexico Peso – USDMXN
The Mexican peso strengthened past 17.15 per US dollar, to test its highest level since mid-2024 as investors cheered a US Supreme Court ruling that struck down President Trump’s global tariffs. The court decision to invalidate broad emergency duties removed a major headwind for Mexico’s export-heavy economy and fueled a sharp relief rally. Despite ongoing geopolitical tensions in the Middle East, the peso benefited from improved trade sentiment and narrowing risks of supply chain disruptions. The currency had its best weekly performance in months.
Mexico’s currency is part of a carry trade that involves investors borrowing in currencies that have low interest rates, such as the Japanese yen or Swiss franc, and buying higher yielding ones such as the Mexican peso or, recently, the U.S. dollar. The MXN has boomed in popularity as interest rates have diverged around the world and market volatility has stayed low. after the Mexican election last year the peso had a dramatic fall against the yen, it dropped 4.4% on that Monday in its biggest daily decline since the COVID-19 crisis. Since then, the Peso regained its strength.

The peso had climbed to the strongest in almost nine years driven by relatively high local interest rates and low currency volatility until, that sell off.
Brazilian Real – USDBRL
The Brazilian real is struggling to sustain its mid-2024 highs after hitting 5.12 per US dollar on February 23rd. Brazil saw to a reversal in domestic inflation and renewed global trade instability following the February 20th US Supreme Court ruling on IEEPA tariffs. The currency initially rose on a massive real-yield spread with the Selic rate at 15%, confidence fractured after mid-month inflation jumped 0.8% against a 0.6% forecast in mid-February. This spike, the steepest in a year, forced a hawkish shift by reducing the chance of a 50-basis-point cut on March 18th. Pressure was intensified by the US administration pivot to Section 122 surcharges, which launched a 10% global import tax on February 24, threatening Brazil’s 17.4% export momentum. Although record tax revenue of R$2.89 trillion and a $4.34 billion January trade surplus provide a cushion, the real is squeezed as the central bank easing cycle clashes with sticky 4.1% annual inflation and shifting trade laws.

December 19 – Bloomberg (Martha Beck, Vinícius Andrade, Maria Eloisa Capurro and Leda Alvim): “As the currency craters in Brazil, thrusting the country’s markets into the international spotlight for the first time in years, a grim reality is setting in for top economic aides to President Luiz Inacio Lula da Silva. They are, they fear, powerless to do much to stop the panic… The central bank has ramped up intervention in currency markets to try to stem the losses amid what Governor Roberto Campos Neto called an ‘atypical’ outflow. It has stepped in either directly or through swaps almost every day for the past week, spending close to $14 billion to give some support to the real… On Thursday alone it sold $8 billion in back-to-back spot auctions — that’s the biggest daily sale of dollars since at least 1999, when Brazil adopted a floating exchange rate regime…”
Europe
Euro – EURUSD
EURUSD back to the highest as the Dollar Index decreased to 97.91, the lowest since December 2025. The Euro makes up around 57% of the dollar index. The Eur has continued to bump up against that downtrend line from 2020 and spinning around the 50% of that year’s panic sell. The euro trades in what seems like eternal flags in the channel. We watch if Kijun testing Tenkan creates any impulse as EURUSD consolidates over the cloud and break up level from 2022. Watch 3 waves to see development for continuation and for impulse off Chikou rebalance. Governed by EURGBP and Bund volatility.

British Pound – GBPUSD
British pound rose above $1.35, its highest level in over two weeks with lower expectations for Bank of England rate cuts following comments from policymaker Megan Greene and stronger-than-expected UK economic data. Greene noted that a central bank survey suggests the decline in wage growth has run its course, and she expressed less concern over slowing disinflation, while looser US monetary policy could support higher UK inflation.
In the bigger picture cable rose in a classic rising wedge since its late 2022 spike classic retest until its daily break late 2024 which brought a weekly kiss of death. From there a weekly cloud break with magnet pulls of cloud twist after ABC correction – will need Tenkan to break through Kijun for more strength. The upcoming months will be heavy on UK data and EU, Ukraine speculation which could mean an eventful time for the British pound.

Swiss Franc USDCHF
Safe haven flows have boosted the Swiss Franc, alongside gold and other precious metals in the past year or so. The franc rose to levels not seen since 2015, despite lower interest rates and the SNB weven musing about negative rates again.


Turkey Lire USDTRY

Political instability and finacial mismanagement in Turkey has seen the Turkish lira collapse. Erdogan’s meddling in the Central Bank in a land of soaring inflation has only further weakened the currency.
Cryptocurrenices

For February Crypto & Crypto-related names were smashed
- BTCUSD: -26.48%
- Grayscale Bitcoin Trust (BTC): -26.39%
- Bitcoin Futures: -26.05%
- Robinhood Markets: -26.64%
- Strategy MSTR MicroStrategy: -18.27%
Bitcoin, Ethereum, XRP, Dogecoin, Solana, Cardano, Chainlink, and Stellar all now have futures contracts. There are now 12 separate Bitcoin ETFs, along with scores for other cryptocurrencies. There are five XRP ETFs, with a dozen more coming. The iShares Ethereum ETF has total assets of $11 billion. How instrumental have levered basis trades become to the crypto universe?
In 2025 cryptocurrencies suffered a serious round of deleveraging. We can assume that huge amounts of leverage have accumulated in this highly speculative marketplace. April’s “pause” rally triggered speculative blowoff dynamics throughout global markets, certainly including crypto. Crypto has not recovered from the selloff in November 2025, Bitcoin sank $18,700, or 17%, during November. On November 21st lows, bitcoin was 26% lower m-t-d. Bitcoin ended the month down 28% from the October 6th intraday high (126,273). For the month, XRP was down 15%, Solana 26%, Binance Coin 26%, and Dogecoin 19%. Ethereum sank 21% in November, with prices off 39% from August highs.
The liquidity backdrop (and perceptions of prospective liquidity) turns increasingly prone to abrupt shifts. Liquidity over-abundance can quickly transition to waning liquidity. And once market perceptions begin to adjust to a deteriorating liquidity backdrop, the marketplace turns acutely vulnerable to the forces of heightened risk aversion, deleveraging, illiquidity, and market dislocation. This process has begun.

Bitcoin
Bitcoin is the world’s biggest digital asset; it had already staged a remarkable comeback in 2023. Then in January the approval of US Bitcoin exchange-traded funds was a further catalyst for gains. Donald Trump’s victory in November turbocharged BTC, sparking a record-breaking rally over the $100,000 level. Along the way, traders poured more than $100 billion into the ETFs, paving the way for similar crypto-related investment vehicles. At the opposite extreme, activity in memecoins, which often trade for a fraction of a cent, exploded.
Trump galvanized the digital-asset community with promises to reverse a US crypto crackdown under President Joe Biden and make America the center of the industry. In the weeks after the election, he announced the newly created post of czar for AI and crypto, and named industry proponent Paul Atkins to replace crypto nemesis Gary Gensler at the Securities and Exchange Commission.
2025 set a record for US ETF fund flows, with Trump’s presidential victory giving already emboldened investors even more incentive to double down. Funds that track the S&P 500 took the most flows, one of the most notable new entrants was BlackRock’s Bitcoin ETF drawing the third-most inflows in 2025.
“After years on the fringes, crypto hedge funds entered 2025 hoping for a breakout. New regulations, White House support and billions in institutional capital were meant to drag crypto out of the frontier into the mainstream. Instead, the year laid bare crypto’s unforgiving terrain, even for professionals built to profit from volatility. Through November, directional funds — designed to profit from large price swings in Bitcoin and other major coins — are down 2.5%, on pace for their worst year since the industry’s 2022 winter… Fundamental and altcoin-heavy strategies, where managers take long-term, bottom-up views on blockchain networks and tokens, are down about 23% after sharp drawdowns.” December 19 – Bloomberg (Sidhartha Shukla)
“Bitcoin was once considered too volatile, too unregulated, and too fringe for the kinds of financial instruments that respectable Wall Street firms package up and sell to wealthy clients. No longer. In July, Jefferies Financial Group Inc. issued the first US structured note tied to BlackRock Inc.’s Bitcoin exchange-traded fund. Since then, at least three other banks, including Goldman Sachs…, Morgan Stanley and JPMorgan… have followed suit. Together, they’ve sold more than $530 million in notes linked to iShares Bitcoin Trust (IBIT)… In effect, banks are wrapping crypto exposure into new products that offer returns tailored to distinct risk appetites with some downside protection. The pitch: investors get leveraged upside if Bitcoin rises and a buffer if it falls.” December 16 – Bloomberg (Lu Wang)
The Crypto Crash of November 2025
From its October 6th high to Friday’s intraday low (80,554), bitcoin has collapsed 36%. Bitcoin slumped 10.4% this week (w/e Nov 21) (outperforming many of its peers).
November 21 – Bloomberg (David Pan): “Bitcoin is crashing into dangerous territory — and options-fueled selling is adding to the volatility. The largest cryptocurrency dropped as much as 7.6% on Friday to $80,553, deepening a selloff that’s erased nearly 25% of its value this month. November is now shaping up to be Bitcoin’s worst month since the 2022 collapse of Terra and FTX — a stretch that triggered a cascade of corporate failures across the industry.”
The hedge fund community is the dominant player in a crowded market for Fannie and Freddie shares. Ackman’s comment as confirmation that hedge funds have accumulated significant exposures to bitcoin and crypto currencies. De-risking/deleveraging gained important momentum this week. Mounting crypto losses are spurring liquidations from Fannie and Freddie shares to technology and AI stocks to risk assets more generally – and globally.
November 21 – Bloomberg (By Jim Silver): “Bill Ackman says ‘forced liquidations and margin calls in crypto’ are leading to selling of Fannie Mae and Freddie Mac shares. ‘I underestimated how much exposure Fannie and Freddie (‘F2’) have to crypto, not on balance sheet, but in their shareholder bases,’ Ackman says… ‘We don’t own bitcoin, but clearly in the short term, we own a stock market proxy for bitcoin’.”
From their September 12th highs (15.99 and 14.99), the stocks of Fannie Mae and Freddie Mac have both dropped 47%.

Bitcoin is performing technically to perfection. Impulse begets impulse. To understand panic, understand greed. Bitcoin exploded higher following its correction impulsively upon completing 5 waves up at +2/8. Each Tenkan and Kijun tap saw an explosive kiss of death until we completed 3 waves to around 28,000. From there we have seen extreme volatility to a new record high and retests.
December 17 – Bloomberg (David Pan): “Bitcoin’s most entrenched investors are still cashing out — and the pressure is starting to show. More than two months after the token hit a record high above $126,000, Bitcoin has fallen nearly 30% and is struggling to find support. One reason: long-time holders haven’t stopped selling. New blockchain data shows that coins held for years are being divested at some of the fastest rates in recent memory… According to a report from K33 Research, the amount of Bitcoin that had remained unmoved for at least two years has declined by 1.6 million coins since early 2023, roughly $140 billion worth. That signals sustained selling by long-term holders.”

We have seen what you would expect from a 5-wave impulse peak and ABC correction, a violent correction and completion. Use Murrey Math levels for corrections and targets as algorithms control the herd here, support is the cloud and sharp ABC, 1-2 moves. From there prices agitated towards those ATHs as news of a Bitcoin ETF fueled the rally, sound familiar? But this time it wasn’t signaling we are in a 3 high probability but a 5.
Solana


Ethereum
Bloomberg Intelligence analysis on Nov 26 from James Seyffart, “Ethereum ETFs & Basis-Trade Impacts.” A most abbreviated summary below:
“Hedge funds, the second-largest known holders of US spot Ethereum ETFs, likely contributed to the category’s $12.9 billion of inflows from April into October and the $2.5 billion of outflows since then via the Ether basis trade… Though Bitcoin’s ETF’s absolute flows were larger (a $27.5bn inflow, followed by a $5.4bn outflow in the past seven weeks), the relative moves were much greater for Ether ETFs. The group’s assets peaked at $32.2 billion in early October thanks to inflows and Ether’s rising price. But they slid to less than $17 billion… Ethereum ETFs flows this year have been impacted by changes in the yield from the Ethereum basis trade… Hedge funds account for 38% of Ethereum ETF holders, widening their lead over the 25% share in Bitcoin ETFs… Some hedge funds and other holders are almost certainly using the ETFs as the long leg of an Ethereum futures basis trade.”


Doge Coin


On the Risk Radar
Geopolitical Tinderbox Radar
The Week Ahead – Have a Trading Plan
Watch Earnings, Central Bankers and Geopolitics speeches, reports and rate moves.
Next Week’s Risk Dashboard
Global Week Ahead Highlights
- Comparing oil shocks then and now
- The method behind Iran’s strategy
- Why no one size fits all when evaluating oil shocks by country
- Monepalooza — a preview of fourteen coming global central bank decisions
- Global macro
US Economic Highlights
With the longest government shutdown in US history now over, major statistical agencies have announced plans to publish updated schedules for the delayed economic releases. Uncertainty remains, however, as several key reports may ultimately be abandoned if agencies are unable to complete them due to disrupted data collection.
- Monday: January Construction Spending (prior 0.3%) at 10:00 ET
- Tuesday: Revised Q4 Productivity (prior 2.8%) and revised Q4 Unit Labor Costs (prior 2.8%) at 8:30 ET; flash March S&P Global U.S. Manufacturing PMI (prior 50.2) and flash March S&P Global U.S. Services PMI (prior 50.4) at 9:45 ET; and $69 bln 2-yr Treasury note auction results at 13:00 ET
- Wednesday: Weekly MBA Mortgage Index (prior -10.9%) at 7:00 ET; Q4 Current Account Balance (prior 0.2%) and February Import/Export prices at 8:30 ET; weekly crude oil inventories (prior +6.16 mln) at 10:30 ET; and $70 bln 5-yr Treasury note auction results at 13:00 ET
- Thursday: Weekly Initial Claims (prior 205,000) and Continuing Claims (prior 1.857 mln) at 8:30 ET; weekly natural gas inventories (prior +35 bcf) at 10:30 ET; and $44 bln 7-yr Treasury note auction results at 13:00 ET
- Friday: Final March University of Michigan Consumer Sentiment (prior 55.5) at 10:00 ET
Bond Market Highlights
- Monday: 3-, 26-week bills;
- Tuesday: 6-week bills; $69 bln 2-yr Treasury note auction results at 13:00 ET
- Wednesday: 17-week bills; 4-, 8-week bills; $70 bln 5-yr Treasury note auction results at 13:00 ET
- Thursday: $44 bln 7-yr Treasury note auction results at 13:00 ET
- Friday: All Clear
Central Bank Highlights
After RBA was first major bank to raise the market pricing of Central Bank interest rate moves by year end was adjusted. Central bank decisions this week sees four more central banks will weigh in with decisions this week following the fourteen who updated their views over the past week. None are expected to change their current policies, but the bias may be key. They are all commodity sensitive central banks and so their guidance could further inform policy attitudes across other commodity sensitive central banks.
BCCh—A Double Whammy on the Terms of Trade
Chile’s central bank will be first out of the gates with its decision on Tuesday (5pmET).
Markets and consensus expect the overnight rate to remain at 4.5% in an extension of the on-hold narrative since cutting in December. The quandary facing the central bank is achievement of its inflation goals—which may merit easing—in the face of rising upside risk to future inflation. BCCh may elect to take its time in assessing conditions.
BCCh had forecast in December that CPI would land on its 3% objective in 2026Q1. This happened sooner than expected as the latest reading for February fell back to 2.4%. CPI excluding volatile items is running at 3.4% and so the central bank can claim to be broadly on track.
Still, copper prices are dropping back to where they were at year-end which means less money coming into the country while oil prices are rising which means more money leaving given the country’s net oil importer status (here). The combined terms of trade effects imply a squeeze on incomes.
Further, the 6% depreciation of the peso since February 25th adds some upside risk to imported inflation (chart 12).
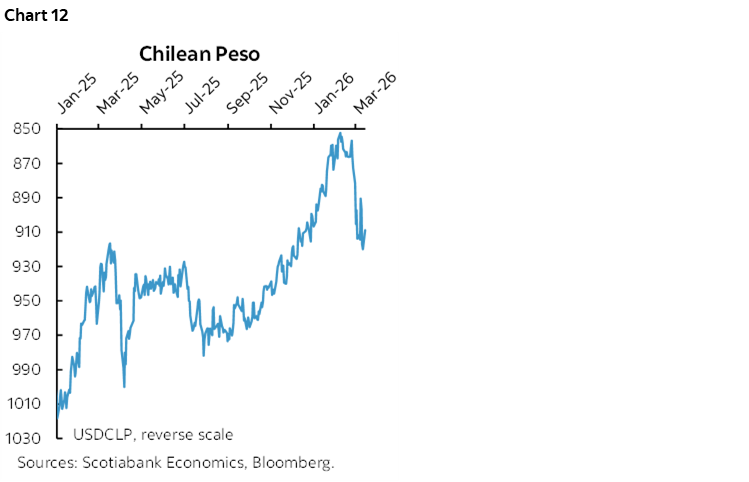
Norges—Course Correction?
Norway’s central bank is expected to stay on hold at a deposit rate of 4% on Thursday. What it does on the bias could be instructive to other central banks in commodity exporting countries.
Key, however, is whether the central bank’s prior guidance in January will be rewritten in fresh forecasts and forward guidance. Recall that on January 21st, Norges Bank guided that “if the economy evolves broadly as currently envisaged, the policy rate will be reduced further in the course of the year.”
Granted, even that guidance was cautious in nature as Governor Ida Wolden Bache stated “We are not in a hurry to reduce the policy rate further. Inflation is still too high.” Soon after saying so, mind you, inflation tumbling from 3.6% y/y to 2.7% and underlying CPI inflation slipped to 3% (3.4% previously).
Enter the oil shock and Norway’s status as a significant net energy exporter. Markets are pricing most of one quarter point hike by summer. This shouldn’t necessarily surprise, given the connection between Brent and the deposit rate over time albeit with often lagging adjustments that may make nearer term tightening premature (chart 13).
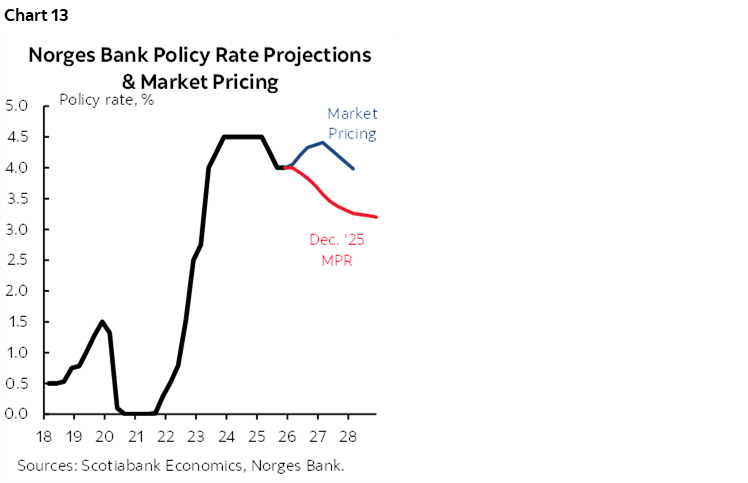
SARB—Unmoored
South Africa’s central bank is expected to stay on hold at a repo rate of 6.75% on Thursday. It has been cutting the policy rate since September 2024 and now faces market pressure to pivot toward tightening policy by the second half of the year.
At 3% y/y, headline inflation’s continued descent into February might be construed as providing room for policy easing. That’s unlikely as backward data is put on the backburner in the face of forward-looking risks.
South Africa is dependent upon energy imports (here). The rand has been among the worst currency performers in the world, having lost about 6% of its value to the dollar since late January. The combination of higher oil prices and a falling currency adds to imported inflation risk.
That hasn’t exactly gone unnoticed by markets. Longer term inflation expectations have been rising sharply (chart 14). SARB is sure to take note, putting in place either the risk of a hike and/or hawkish forward guidance.
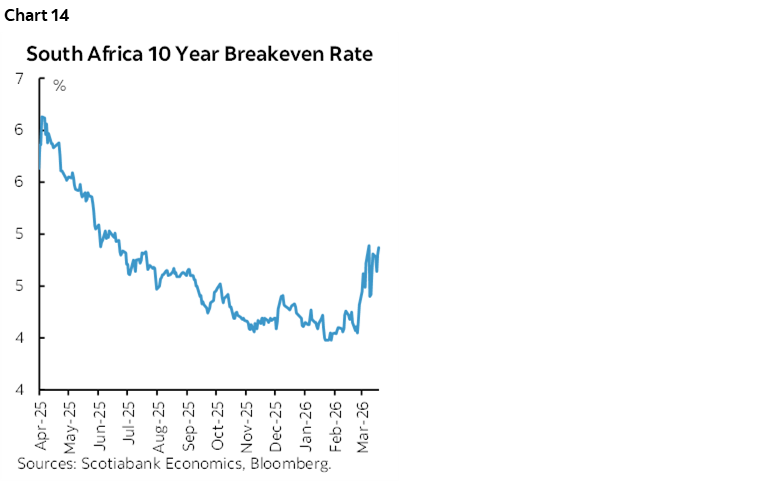
Banxico—Energy Shock May Further Embolden the Hawks
When Mexico’s central bank last weighed in on February 6th, they paused the easing cycle because Governing Council was concerned about ongoing inflation risk. The easing campaign before that meeting was dividing members who pivoted toward full agreement to halt cuts.
You might think they would be hesitant to restart it now. Hawks like Deputy Governor Heath—who was previously warning and dissenting against easing—have already weighed in. He said about a week ago that “I think we should have paused in March, and now, taking into account a more complex scenario due to the armed conflict in the Middle East, even more so.”
The further unmooring of market-based measures of inflation expectations is bound to be of concern to Banxico and to markets that are pricing the next moves to be upward as soon as later in the year (chart 15).
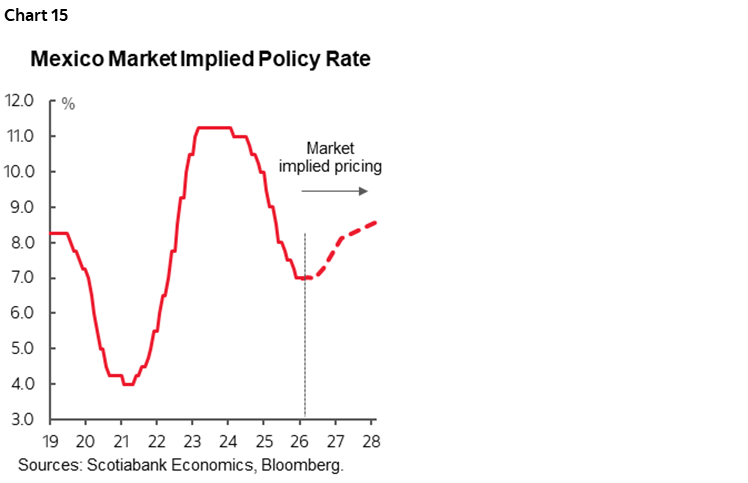
Yet consensus is split between a cut and a hold.
Commentary via Scotiabank, Bloomberg
US Earnings Highlights
- Monday: WeRide (WRD).
- Tuesday: GameStop (GME), Smithfield Foods (SFD), and Braze (BRZE).
- Wednesday: PDD (PDD), Paychex (PAYX), Chewy (CHWY), Winnebago (WGO), Jefferies (JEF), Noodles (NDLS), Widepoint (WYY)
- Thursday: Commercial Metals Company (CMC)
- Friday: Carnival (CCL).
US IPO Highlights
No IPOs are currently scheduled in the week ahead, as ongoing geopolitical uncertainties continue to rattle investors, although some smaller issuers may join the calendar throughout the week.
While activity may remain quiet in the coming weeks, several sizable names in the active pipeline are eligible to launch their roadshows next week. Fleet management software provider Motive Technologies (MTVE), senior housing REIT Janus Living (JAN), online travel booking platform Klook (KLK), online lending platform Lendbuzz (LBZZ), and crypto-focused investment product provider Grayscale (GRAY) are all eligible to set terms.
Week Ahead
Source: Renaissance Capital
Focus on yourself and what YOU CAN INFLUENCE, set your trading plan and goals in be set for 2025.
Trade Smart!

Subscribe and Follow
Find us at www.traderscommunity.com
Real Time Economic Calendar provided by Investing.com.
Follow our contributors on Twitter @traderscom @thepitboss16 @knovawave @ClemsnideClem
Note these charts, opinions news and estimates and times are subject to change and for indication only. Trade and invest at your own risk.
Trade Smart!
Focus on yourself and what YOU CAN INFLUENCE, set your trading plan and goals in be set for 2025.
-comment section below data-
Subscribe and Follow
Find us at www.traderscommunity.com
Follow our contributors on Twitter @traderscom @thepitboss16 @knovawave @ClemsnideClem
Note these charts, opinions news and estimates and times are subject to change and for indication only. Trade and invest at your own risk.
Trade Smart!