April 25, 2025
FEAR NOT Brave Investors
Where have we been and where are we going? Join our weekly market thread on Traders Community…

Market Dynamics and Instability
The Week That Was – What Lies Ahead?
Fear and Greed Feed Volatility
Contents
Click on the links below to navigate to the relevant section.
- Part A: Stock markets
- Part B: Bonds
- Fed and Banks
- Part C: Commodities
- Energy – Oil and Gas
- Gold and Silver
- Part D: Foreign Exchange
- Geopolitics and Economics
- Economy Week ahead

Editorial
In the daily risk on, risk off by mid-week “Risk off” was in retreat. Stocks rallied hard this week. The VIX closed below 25 for the first time in three weeks. High yield CDS dropped, and spreads narrowed. Junk bond and leveraged loan markets mustered limited re-openings. Treasuries rallied, though the swaps market remained notably unstable. But when it comes to crisis of confidence dynamics, the dollar’s meager 0.2% gain didn’t allay concerns, though lower yields also tempered the rise.
The S&P 500 (+4.6%), now up rising 10.9% from its low close on April 8 (4,982.77). The Nasdaq Composite flew 6.7% this week and the Dow Jones Industrial Average booked a 2.5% gain. Monday started weak as stocks dropped on Monday in response to chatter that President Trump and his team are looking into whether the president can remove Fed Chair Powell, with markets quaking on attacks to the Fed’s independence. Communist China, no surprise here warned of retaliation against countries that curtail their trade with China because of U.S. pressure in trade negotiations.
Then President Trump declared that he has no intention of firing Fed Chair Powell. Powell’s job is safe. Trump said “The press runs away with things.” U.S./China trade war de-escalation. “We’re meeting with China. We’re doing fine with everybody.” He indicated he won’t play hardball with China in any negotiations and that China’s tariff rate will come down substantially (but not to zero) if a deal can be reached.
The Treasury market provided added support to equities. The 10-yr yield was six basis points lower than last week at 4.27% and the 2-yr yield was four basis points lower than last week at 3.76%.
The upside bias was helped by algos pushing short-covering and contrarian buying interest. Outsized gains in the mega cap space contributed to the overall performance with four mega 7’s reporting next week. This week Tesla (TSLA) saw an 18.1% increase after a dour Q1 earnings report that was tempered by Elon Musk indicating he will be curtailing his DOGE work. Alphabet (GOOG) shares jumped 6.8% after reporting earnings.
“Foreign investors have sold $63 billion of US equities since the start of March, Goldman Sachs strategists estimate, noting that the data from high-frequency fund flows suggest that European investors have been driving the selling, while other regions have continued to buy US stocks. ‘This dynamic poses a substantial risk to equity valuations because foreign investors entered 2025 with a record 18% ownership share of US equities’…” April 25 – Bloomberg (Jan-Patrick Barnert)
The Vanguard Mega Cap Growth ETF (MGK) jumped 7.4%. S&P 500 technology sector bounced 7.9%, the consumer discretionary sector surged 7.4%, and the communication services sector rose 6.4%.
Prospects for inflation are both troubling and highly uncertain, Fed Chair Powell made that clear during his sit down this week. The trade war with China will accelerate decoupling between the world’s great consumer and producer economies, a dynamic conducive to supply-chain problems and ongoing inflationary pressures. A seizing up of global markets has the potential to unleash the forces of economic depression and deflation. Globalization has been a powerful force for lower goods prices., something that in rebuilding the U.S. industrial base would see a high-cost producer replace a low-cost producer.
We have seen the basis trade burst at its seems and the lifting of reciprocal tariffs as crisis dynamics gain momentum. At this juncture the Fed and global central bank community will be faced with having to aggressively expand their balance sheets to accommodate speculative deleveraging and counteract acute systemic stresses. Markets seem to be taking the proven bet that the Fed wil be forced into another aggressive round of QE despite elevated inflation risk to counter global market instability and deleveraging.
Stress remains almost across the board with “carry trades”, “basis trades” and especially the “swaps” derivatives marketplace. We have seen some unwinding the massive “basis trade” in Treasuries. To reiterate what we saw last week volatility so far seems about price discovery in the wake of US policy shocks rather than signs of market dysfunction.
Apparent anomalies in how markets are responding to rash and sudden developments may have sound explanations and could stabilize, versus extrapolating these developments with extreme and premature views such as how they finally represent the end of longstanding dollar dominance and US exceptionalism.
Quick Look at The Week Gone By:
- S&P500 rose 4.6% (down 6.1% y-t-d),
- Dow recovered 2.5% (down 5.7%).
- Nasdaq100 rallied 6.4% (down 7.5%).
- S&P 400 Midcaps gained 3.2% (down 9.3%),
- Small cap Russell 2000 jumped 4.1% (down 12.2%).
- Crude oil lost nearly $1/bbl for the week,
- U.S. Dollar Index rose 0.1% to 99.51 Friday, adding 0.3% for the week.
- Gold futures settled $50.20 lower (-1.5%) at $3,298.40/oz Friday, down -0.9% on the week. A stronger U.S. dollar weighed on prices.
- 2-yr: -3 bps to 3.76% (-4 bps this week)
- 3-yr: -3 bps to 3.76% (-4 bps this week)
- 5-yr: -4 bps to 3.88% (-6 bps this week)
- 10-yr: -4 bps to 4.27% (-6 bps this week)
- 30-yr: -3 bps to 4.74% (-6 bps this week)
Mega cap stocks had an outsized impact on the broader equity market. We did also see some sharp short covering in tech stocks in particular:
- Palantir: +19.88%
- Robinhood Markets: +19.72%
- Trump Media & Technology Group: +18.83%
- Tesla: +18.06%
- SoFi Technologies: +17.21%
- MicroStrategy: +16.26%
- Shopify Inc: +16.10%
- Micron: +15.92%
- Super Micro Computer: +15.76%
- Nio A ADR: +14.35%
- Netflix: +13.20%
- CrowdStrike Holdings: +13.11%
Central Banks This Week
- The People’s Bank of China made no changes to its one-year and five-year loan prime rates.
- The Bank of Japan is expected to continue its tightening cycle despite threats to growth from U.S. trade policy. However, the market does not expect the BoJ to announce a rate hike on May 1.
- European Central Bank policymaker Rehn said that the ECB should not rule out larger interest rate cuts.
This week’s key U.S. Economic Reports:
- March Leading Indicators -0.7% (consensus -0.4%); Prior was revised to -0.2% from -0.3%
- Weekly MBA Mortgage Applications Index -12.7%; Prior -8.5%
- April S&P Global US Manufacturing PMI – Prelim 50.7; Prior 50.2
- April S&P Global US Services PMI – Prelim 51.4; Prior 54.4
- March New Home Sales 724K (consensus 684K); Prior was revised to 674K from 676K
- March Durable Orders 9.2% (consensus 1.5%); Prior 0.9%, March Durable Goods -ex transportation 0.0% (consensus 0.3%); Prior 0.7%
- Weekly Initial Claims 222K (consensus 220K); Prior was revised to 216K from 215K, Weekly Continuing Claims 1.841 mln; Prior was revised to 1.878 mln from 1.885 mln
- March Existing Home Sales 4.02 mln (consensus 4.20 mln); Prior was revised to 4.27 mln from 4.26 mln
Geopolitical contagion impacts
Prospects for inflation are both troubling and highly uncertain, Fed Chair Powell made that clear during his sit down this week. The trade war with China will accelerate decoupling between the world’s great consumer and producer economies, a dynamic conducive to supply-chain problems and ongoing inflationary pressures. A seizing up of global markets has the potential to unleash the forces of economic depression and deflation. Globalization has been a powerful force for lower goods prices., something that in rebuilding the U.S. industrial base would see a high-cost producer replace a low-cost producer.
April 16 – Financial Times (William Sandlund and Chan Ho-him): “Donald Trump’s on-off tariffs have pushed currency volatility to multiyear highs and boosted demand for foreign exchange hedging products as companies struggle to adjust to market swings. Currency volatility has surged in recent days to levels last reached during the collapse of Silicon Valley Bank and Credit Suisse in March 2023… The uncertainty around Trump’s tariffs has created more demand for FX hedging products to offset sudden fluctuations in exchange rates that are hitting businesses with global operations, according to banks and executives at multinational companies.”
April 8 – Bloomberg (Vassilis Karamanis): “Currency traders are positioning for turbulence in currency markets to get even worse as an escalating trade war shakes up the global economic order. The dollar and its peers have been whipsawed by some of the sharpest price swings since the 2008 financial crisis… Options volumes surged to a record last week and uncertainty around the trade war has now pushed expectations for volatility in the next month to a two-year high. ‘Volatility in FX has been completely insane,’ Brent Donnelly, president of Spectra FX Solutions LLC., wrote… ‘We saw one of our biggest weeks ever on the trading side as volumes are gigantic and everyone is doing all kinds of stuff.’”
Tariff Watch
- “Tariffs are starting to hit American meat exports, with China making its biggest cancellation of pork orders since 2020, according to… the US Department of Agriculture. The cancellation of 12,000 metric tons of US pork was the most since the Covid-19 pandemic roiled global supply chains. For the week, overall US pork export sales fell to the lowest level since October.” April 24 – Bloomberg (Michael Hirtzer)
- Section 232 investigations have been announced for semiconductor, semiconductor equipment, pharmaceuticals, and pharmaceutical ingredients, laying the groundwork for likely tariff increases
- Bloomberg reports that the EU and US have made little progress on trade talks and that the EU expects most tariffs to remain in place.
- Bloomberg reports that China has ordered airlines to stop taking Boeing (BA) deliveries.
- President Trump also suggested there may be tariff adjustments for the auto sector
- Apple, Nvidia Score Relief from US Tariffs with Exemptions (see more below)
President Donald Trump’s administration exempted smartphones, computers and other electronics from its reciprocal tariffs, representing a major reprieve for global technology manufacturers including Apple Inc. and Nvidia Corp. even if it proves a temporary one. The exclusions, published late Friday by US Customs and Border Protection, narrow the scope of the levies by excluding the products from Trump’s 125% China tariff and his baseline 10% global tariff on nearly all other countries.

The move is the first significant softening of any kind in Trump’s conflict with China. It was backdated to April 5. The exemptions cover almost $390 billion in US imports based on official US 2024 trade statistics, including more than $101 billion from China, according to data compiled by Gerard DiPippo, associate director of the Rand China Research Center.
- The biggest category related to China is smartphones. The US imported smartphones valued at more than $41 billion from China in 2024, or about 9% of total imports from China. Also covered are computers and similar devices, of which the US imported more than $36 billion in 2024.
- Altogether the exemptions cover consumer electronics and semiconductors that accounted for about 22% of US imports from China in 2024, DiPippo said.
Also crucial are new exemptions on semiconductor manufacturing equipment, made by companies such as ASML Holding NV in the Netherlands and Tokyo Electron Ltd. in Japan. Those tools are essential for building chip factories and comprise the lion’s share of the multibillion-dollar price tag for such plants. Companies including TSMC, Samsung, and Intel Corp. are building new US facilities with support from the 2022 Chips and Science Act.
Trump’s initial “reciprocal” tariff announcement included exemptions for semiconductors and other sectors, to which Trump has regularly pledged to apply a specific tariff. He hasn’t yet done so but the latest exclusions are related to that exemption.

“The U.S. is moving to blow up the global trading order it built, ushering in an uncertain new era. President Trump’s highly anticipated announcement… represents a high-stakes gamble to transform a global economic relationship that Trump for decades has said ripped off the U.S.—even as the American economy had emerged from the pandemic as the envy of its rich-world peers. The president’s moves raise the specter of a stagflationary shock that increases prices while putting more economies, including the U.S., at risk of recession. Trump stunned markets by announcing a suite of tariff hikes on major trading partners, including 20% for the European Union and 34% on China. The tax on imported goods, which also includes at least a 10% across-the-board increase on all countries, will raise overall weighted-average tariffs to 23%—the highest in over 100 years—from 10% before the announcement and 2.5% last year, according to JPMorgan Chase.” April 3 – Wall Street Journal (Nick Timiraos)
FOMC Presser Chair Powell (Pre Trump-Tariffs) said this:
- “It is going to be very difficult to have a precise assessment of how much is coming from tariffs. Goods inflation moved up this year but it’s very challenging to trace it back to non-tariff inflation versus tariff inflation. In terms of looking through, it’s too soon to say that. Sometimes it’s appropriate to do that. That would depend on tariff inflation moving through pretty quickly and longer-term inflation expectations being well anchored.”
- He went on to note that “We were getting closer and closer to price stability but we were not at that. The arrival of further tariff inflation could delay this. The forecast does show us getting into the low 2s further out.” And so the message is that for now they are erring on the side of caution by raising inflation and becoming more patient on timing further easing.
Central banks are hamstrung by elevated inflation and trade war risks. No time like the present, no less than eleven global central banks will weigh in with monetary policy updates this week. This includes three of the big dogs, the Federal Reserve, Bank of Japan and the Bank of England. Patience is required given the uncertainty and the many possible burifications from how they act and communicate. No doubt, whether as an excuse or because they genuinely are, less confidence in the path forward will feature prominently in the communications.
A dangerous market for those not trading with discipline and booking profits. Not one with emotion and preset views dictated by hope, politics or a talking head’s opinion.
*** Economic summaries via Briefing
Stagflation
The trade war has piled onto stagflation fears that came with the previous week’s PCE data. Concern that Trump’s trade war will trigger a worldwide recession are weighing with the risk that the same punitive tariffs may unleash another bout of inflation. US government debt rallied hard. which is critical to the Trump strategy to bring down rates as they need to rollover debilitating trillions of dollars of U.S. debt.

The two-year yield hit the lowest since 2022, traders are pricing in a greater chance the Federal Reserve moves most aggressively to cut interest rates to keep the economy from stalling. 10-year yields tumbled below 4% for the first time since October. This however is ignoring Fed Chair Jerome Powell’s comments about the inflationary impact of tariffs at their own peril.
Stagflation risks came back to the fore hurting markets after the Personal Consumption Expenditures report was good on the income side, but the spending side is just hanging in there (real PCE up just 0.1%) and was bad on the inflation side with the uptick in the core-PCE Price Index (the Fed’s go to) by 0.4%, bringing the annual rate to 2.8%. Potentially mixing toxic cocktail to stir some stagflation angst for the Fed in a wait-and-watch mode on rates.

With all the negative press, job and inflation worries the Consumer Confidence Index understandably revealed a fourth consecutive decline. The Expectations Index fell to its lowest level (65.2) in 12 years, with future employment prospects and inflation concerns weighing.
Following the affective dead cat bounce in Tech stocks the same stocks peppered the reversals back down. The S&P technology sector was down 3.7%. The Bloomberg MAG7 Index closed the week only slightly above March 11th intraday lows, with the S&P500 ending the week 1.4% off March 13th trading lows. NVIDIA (NVDA) dropped 6.8%, Microsoft (MSFT) dropped 6.8%, and Amazon.com (AMZN) dropped 1.8%. The equal-weighted S&P 500 fell 1.2%. Just four S&P 500 sectors finished higher on the week with consumer staples best with a 1.7% gain.
Treasury bonds rallied hard after the week’s data with the 5-yr yield back below its 200-day moving average (4.069%) to its lowest settlement in nearly three weeks while the 10-yr yield finished the day just above the 200-day moving average of 4.223%. This week’s outperformance in shorter tenors widened the 2s10s spread by five basis points to 35 bps.
Transitory
After the most recent FOMC during his press conference, Fed Chairman Powell brought the ‘Transitory word back and reiterated there is no rush to adjust policy. “Transitory” was spoken five times during the post-meeting press conference, twice by Chair Powell. He warned that it is “going to be very difficult to have a precise assessment of how much inflation is coming from tariffs.” He indicated that it’s “kind of the base case” that inflationary pressures from tariffs would be transitory, adding that the last time tariffs were imposed, the increase in prices was transitory. The market remains on high alert about the specter of reciprocal tariffs being announced on April 2.
Chair Powell: “As I’ve mentioned, it can be the case that it’s appropriate sometimes to look through inflation if it’s going to go away quickly without action by us, if it’s transitory. And that can be the case in the case of tariff inflation. I think that would depend on the tariff inflation moving through fairly quickly and critically, as well on inflation expectations being well-anchored, longer-term inflation expectations being well-anchored.”
- Fed Chair Powell indicating that did not seem too concerned with the recent volatility in markets. He acknowledged that tariff increases are larger than expected, which will provide a stronger headwind to growth, but he also said that the FOMC will patiently wait for greater clarity before making any adjustments to policy.
Geopolitical: Chaos Ramps Up
We have seen the basis trade burst at its seems and the lifting of reciprocal tariffs as crisis dynamics gain momentum. At this juncture the Fed and global central bank community will be faced with having to aggressively expand their balance sheets to accommodate speculative deleveraging and counteract acute systemic stresses. Markets seem to be taking the proven bet that the Fed will be forced into another aggressive round of QE despite elevated inflation risk to counter global market instability and deleveraging.
Stress remains almost across the board with “carry trades”, “basis trades” and especially the “swaps” derivatives marketplace. We have seen some unwinding the massive “basis trade” in Treasuries. To reiterate what we saw last week volatility so far seems about price discovery in the wake of US policy shocks rather than signs of market dysfunction
Greenland
- President Trump (March 27, 2025): “So we’ll, I think, we’ll go as far as we have to go. We need Greenland. And the world needs us to have Greenland, including Denmark. Denmark has to have us have Greenland. And, you know, we’ll see what happens. But if we don’t have Greenland, we can’t have great international security.”
- President Trump (March 28, 2025): “We need Greenland, very importantly for national security. We have to have Greenland. It’s not a question of, ‘Do you think we can do without it?’ We can’t… Greenland’s very important for the peace of the world. And I think Denmark understands, and I think the European Union understands it. And if they don’t, we’re going to have to explain it to them.”
South China Sea
- March 28 – Daily Mail (Geoff Earle): “Defense Secretary Pete flexed his muscles in a workout with U.S. troops in the Philippines as he identified China as a threat and called for deterrence. ‘There’s a long line of countries in the past who have attempted to test U.S. resolve… We are resolved at this time… to work with our partners.’ ‘Deterrence is necessary around the world, but specifically in this region, in your country, considering the threats from the communist Chinese,’ he said. Hegseth… called for joining with allies to counter Chinese expansionist threats… ‘What we’re dealing with right now is many years of deferred maintenance, of weakness, that we need to reestablish strength and deterrence in multiple places around the globe,’ Hegseth said in response to a question about whether the U.S. would place a more visible presence in the South China Sea.”
- Hegseth: “What the Trump administration will do is deliver – is to truly prioritize and shift to this region [Asia] of the world in a way that is unprecedented.”
- March 28 – Associated Press (Jim Gomez): “U.S. Defense Secretary Pete Hegseth said… the Trump administration would work with allies to ramp up deterrence against threats across the world, including China’s aggression in the South China Sea. Hegseth… blamed the previous Biden administration for insufficient actions that emboldened aggressors like China over the years. He said the U.S. military was being rebuilt under President Donald Trump and was re-establishing its ‘warrior ethos’ in the region… Hegseth told a news conference with his Philippine counterpart, Gilberto Teodoro, after meeting President Ferdinand Marcos Jr…”
Recap: If Ukraine agrees to the rare earth deal, it helps justify the cost, helps take some China retaliation risk off but the big one it makes Ukraine less vulnerable to Putin’s stated aim of taking all of Ukraine. Why? Much of the critical minerals are in the Eastern regions of Ukraine (Donbas) captured by Russia. This makes it more palatable to the U.S to support and protect and Trump has got the response he wanted from the EU, increase your share of the military cost of NATO. Now we will see if these assumptions are correct over the coming weeks.
Week Ahead Catalysts
- Market volatility is likely to persist into the coming week as markets grapple with whether temporary or more profound forces of change are upon financial markets due to unintended effects of Trump’s trade wars. An otherwise active calendar of developments also lies ahead.
- Canada’s election on Monday April 28th.
- Four central banks deliver policy decisions this week. One major, and three regional central banks are on the docket.
- The BoJ statement at around 10:30pmET on Wednesday night will be followed by Governor Ueda’s press conference at around 2:30amET Thursday. Consensus and markets are unanimously positioned for no policy change.
- Big week for lagging US macro reports, Fed watchers will be locked and loaded with another batch of key data to inform how the US is coping with the early days of Trump 2.0 and how that might come to influence the policy bias. Trade wars are likely to put the Federal Reserve’s full employment and price stability mandates in conflict with one another. That path chosen will be determined by data and developments while the FOMC remains patient which has been Chair Powell’s message to date.
- Jobs and inflation that are barely the tip of the iceberg in terms of the reams of evidence the Committee is likely to require going forward.
- The first quarter estimate for growth in the US economy arrives on Wednesday morning. What is typically significant uncertainty is even greater this time around.
- Wednesday brings out a batch of the Federal Reserve’s favourite inflation readings. Q1 core PCE, headline PCE for March and core PCE for the same month are all due. There is uncertainty around the estimates as always, and even among senior Fed officials being guided by Fed economists. Governor Waller said this in his speech on April 14th
- US jobs data for April closes out the week on Friday after a wave of other labor market readings have arrived.
Debt …. Keeps Building
An overheating economy, coupled with tariff and trade war risks, creates a bond market challenge.
“Chuck E. Cheese owner CEC Entertainment is struggling to drum up enough demand for a $660 million high-yield bond sale to refinance debt it has due next year, according to people familiar… JPMorgan… and Goldman Sachs…, the banks leading the deal, had not obtained sufficient orders from investors… One of the people attributed the difficulties to a broader market rout stemming from concerns about the Trump administration’s tariff policies as well as the US economy… Other transactions in the leveraged finance market that are vulnerable to a dip in consumer spending, including casino operator Mohegan Tribal Gaming Authority, have faced investor pushback lately partly because of concerns about the US economy.” March 28 – Bloomberg (Aaron Weinman and Gowri Gurumurthy):
“Several Southern California cities have the most credit card debt per household in the U.S., a new WalletHub study found. Santa Clarita ranked first out of 181 U.S. cities, with a household average of about $22,753 in credit card debt, and a total of about $1.7 billion in debt for its 228,000 residents, according to data taken from the U.S. Census Bureau and TransUnion… Chula Vista was second, with an average of $20,567 in credit card debt per household, and a total of $1.8 billion among its 275,000 residents.” March 21 – Los Angeles Times (Sandra MacDonald):
A Reminder: U.S. and global yields surged higher as the Fed began its easing cycle:
- Ten-year Treasury yields, closing September 17th at 3.65%, ended the year 92 bps higher at 4.57%.
- EM bonds were taken behind the woodshed. For the quarter, spikes in dollar-denominated yields included Panama 177 bps, Brazil 137 bps, Mexico 99 bps, Peru 87 bps, Chile 85 bps, Indonesia 83 bps, Philippines 75 bps, Saudi Arabia 71 bps, and Turkey 58 bps.
- The spike in local currency bond yields was even more dramatic: Brazil 272 bps, Colombia 177 bps, Mexico 109 bps, Turkey 87 bps, Chile 85 bps, Romania 78 bps, Poland 64 bps, Indonesia 54 bps, and the Czech Republic 42 bps.
Was DeepSeek the beginning of the end of the AI Speculative Bubble?
Googles response to DeepSeek
- Alphabet’s Google launched two new AI models on March 12 for robotics applications on its Gemini 2.0 model. Last month robotics startup Figure AI exited its collaboration agreement with ChatGPT-maker OpenAI after it made an internal breakthrough in AI for robots.
- Gemini Robotics is an advanced vision-language-action model that will have physical actions as a way to provide output. The second model, Gemini Robotics-ER, will enable a robot to have an advanced understanding of the space around it and lets developers run their own programs using reasoning abilities offered by Gemini 2.0.
- Google said its models are designed for robots of all form factors including humanoids and other types used in factories and warehouses. Apptronik raised $350 million in a funding round last month led by B Capital and Capital Factory, with participation from Google to scale production of AI-powered humanoid robots.
Basis and Carry Trade Sustainable?
Risk Matters: Don’t forget the August 5th, 2024, Carry Trade Shake:
Discipline with your trading rules, especially as liquidity falls
There is a reason we have strict trading rules here based on psychology, math, experience and avoiding false narratives and dribble out there. That said pay attention to the time of year, the bonus pay dates (no we aren’t being cynical), tax markings and look the previous run ups into Dec 31. Don’t let the grifters out their sway you, VIX is historically low, what does that tell you? Protection is cheap and the market is complacent with no fear. Here endeth the lesson.
Two paths to bankruptcy: gradually and suddenly. – Ernest Hemingway
Where is the Fear in Instability?
Leveraged speculation, including “basis trades,” “carry trades” and run deep and why the yen and Mexican peso are deeply relevant to this whole structure.
“Credit-default swaps in Asia blew out the most since the worsening of the Covid-19 pandemic in 2020… The cost to insure investment-grade debt of Asian issuers outside Japan widened by 26.5 bps on Monday, according to traders, deeper than the 22 bps in earlier trading. If that level holds, it would mark the biggest single-day jump since March 2020…” April 6 – Bloomberg (Ameya Karve, Finbarr Flynn, and Kari Soo Lindberg):
Compressed risk premiums and CDS prices are indicative of complacency. Markets behave this way when there is some underlying monetary disorder (dislocation in liquidity creation). What all this does for markets is keep risk measures on, we see in the vicious VIX fails and short-term option volumes. It is when the risk avoidance measures, or tolerance fails this can trip up the whole structure of buying and cycling through risk assets.
In the backdrop we have war abroad in the Ukraine and Middle East, unsettled relations between Taiwan and China. At home in the US universities and cities to the North have become a quagmire of protest, illegal immigration placement and political vitriol that have deeply divided these regions. The cost of living through it all has sent many working through middle class families to the brink and beyond, insurance costs have risen over 100% in a year in some cases to name just one inflation cost that politicians lie about.
While complacency reigns supreme in equities, bonds are awake to the risk out there.


“We have a market trying to interpret the Fed who is trying to find out how they can interpret their long-only portfolio at a risk parity where rates cannot rise.”– MoneyNeverSleeps
Our weekly reminder for risk, timely given the V shape to ATH. The downside is clear with the absence of moral hazard from repeated Federal Reserve market bailouts in an environment of some would say obscene liquidity pumps. Pure greed is the other part, not wanting to miss out on fees. The obvious question is, how deeply ingrained is this attitude through the markets? How do we ween the markets off this continuous dip feed? At this point the Central Banks have kicked that answer down the road.
Our take remains the Fed is not just focused on inflation but risks such as the commercial real estate debacle, the high US dollar and the massive Federal debt refunding cost.
We need to grasp all the risks to be wary of but not ignore price reaction. We always talk here about expect the unexpected and now that is front and center, gage the market’s reaction, the market is always right and that’s why we focus on the crowd psychology aspect.
Unsuspecting investors in their millions have or will lose meaningful amounts of their savings. They bought into the mania, threw caution to the wind, and will suffer the consequences regardless of the warnings of unsustainability. The reason we started TradersCommunity was for situations like this many moons ago. Beware of those ‘experts’ who never saw the sell off and chided you for believing it now claim to be gurus measuring risk. It’s a bit late when some of these stocks and markets are down 50-90%. Beware of those who claim long term investment when it all goes wrong. Anyhoo..
Oh China
In September 2024 Xi Jinping promised to spend whatever it takes to reach growth targets as he tapped the reflation panic button. A Reuters article placed Beijing’s stimulus at $1.4 TN. On top of a system locked in massive credit expansion, upwards of $5 TN annually. He is pushing hundreds of billions to the stock market, hundreds of billions to the festering local government sector, hundreds of billions to the to attempt to arrest the slide in the apartment markets.
January 31 – Bloomberg: “China’s residential sales resumed falling in January… The value of new-home sales from the 100 biggest real estate companies dropped 3.2% from a year earlier to 227.6 billion yuan ($31.4bn), after being flat in December… Beijing is struggling to revive the property market amid weak domestic demand and a worsening job situation. While the housing sector has picked up modestly on the back of government support, improvements have mostly been in the second-hand market as buyers remain concerned about developers’ ability to finish projects on time.”
January 27 – Financial Times (Thomas Hale and Chan Ho-him): “Leading Chinese property developer Vanke has forecast a $6.2bn annual loss and announced the sudden resignation of its top leadership, reigniting concerns over funding and confidence across China’s economically critical real estate sector. The developer, partly owned by local authorities in Shenzhen, is the latest focal point of a cash crunch that began with the collapse of peer Evergrande in 2021 and has since engulfed a host of other developers including Country Garden. After weeks of swirling concerns over the health of Vanke, the company said… chair Yu Liang had resigned for ‘work adjustment reasons’. It said chief executive Zhu Jiusheng had departed for ‘health reasons’. The ‘sudden and simultaneous’ resignations were ‘unprecedented in recent memory’ for a big participant such as Vanke, said Foreky Wong, founding partner at Hong Kong advisory company Fortune Ark Restructuring.”
January 28 – Bloomberg: “China Vanke Co. has been thrown a lifeline by state authorities, a rare show of support that signals the developer may be too big to fail even after dozens of property firms defaulted amid China’s punishing housing slump. As part of an overhaul unveiled late Monday, Vanke’s two top veteran executives stepped down after the company warned of a record $6.2 billion loss. An official from Shenzhen Metro Group Co., its largest state shareholder, will take over as chair.”
December 18 – Financial Times (Demetri Sevastopulo): “China has increased its arsenal of operational nuclear warheads to 600 from 500 in just a year, as the People’s Liberation Army continues a rapid expansion of its forces, according to the US defense department. In its annual ‘China Military Power Report’, the Pentagon said the PLA had expanded its arsenal by 20% in the 12 months from mid-2023 and was on track to have 1,000 operational warheads by 2030. The Pentagon has in recent years warned that the US will soon face two nuclear peers as China’s arsenal grows closer in size to the US and Russia.”
December 16 – Reuters: “China’s capital markets outflow reached a record high of $45.7 billion in November, according to official data tracking cross-border payments, as Donald Trump’s U.S. presidential election win roiled global portfolio flows. Cross-border receipts from portfolio investments were $188.9 billion, while payments totaled $234.6 billion, resulting in the biggest monthly deficit on record…”
Any pushback to fledgling tightening these days ensures excessively loose financial conditions.
Geopolitical Tinderbox

PART A – Stock Markets
Highlights This Week – USA
- S&P500 rose 4.6% (down 6.1% y-t-d),
- Dow recovered 2.5% (down 5.7%).
- Nasdaq100 rallied 6.4% (down 7.5%).
- S&P 400 Midcaps gained 3.2% (down 9.3%),
- Small cap Russell 2000 jumped 4.1% (down 12.2%).
- Utilities slipped 0.2% (up 4.8 %).
- Banks jumped 5.7% (down 8.3%),
- Broker/Dealers rose 5.8% (up 2.3%).
- Transports increased 0.4% (down 15.1%).
- Semiconductors spiked 10.9% (down 14.6%).
- Biotechs rallied 4.9% (down 3.7%).
- With bullion slipping $7, the HUI gold index fell 2.6% (up 41.2%).


Highlights – Europe Stocks
- U.K.’s FTSE equities index gained 1.7% (up 3.0% y-t-d).
- France’s CAC40 jumped 3.4% (up 2.1%).
- German DAX equities index surged 4.9% (up 11.7%).
- Spain’s IBEX 35 equities index rallied 3.4% (up 15.2%)
- Italy’s FTSE MIB index surged 3.8% (up 9.2%)
Highlights – Asia Stocks
- Japan’s Nikkei 225 Equities Index rallied 2.8% (down 10.5% y-t-d).
- South Korea’s Kospi gained 2.5% (up 6.1%).
- India’s Sensex equities index increased 0.8% (up 0.9%).
- China’s Shanghai Exchange Index gained 0.6% (down 1.7%).
Highlights – Australian Stocks
- Australia’s ASX 200: Thursday +0.6% to 7968.2 (+2.3% on the week)
- Best weekly gain this year.
- Thurs: 8 of 11 sectors green, led by healthcare in the holiday-shortened trading week.
- Gold stocks tracked a rebound in gold prices. Emerald Resources lifted 3.3% to $4.04, and Newmont rose 3.5% to $85.20 as investors shrugged off a 19% fall in the US gold miner’s quarterly output.
- Iron ore miners rose as prices of the steelmaking ingredient neared $US100 a tonne, with BHP up 0.9% to $38.06.
- Banks extended gains with Westpac adding 1.1% to $32.04 and ANZ by 1.6% to $28.84. Commonwealth Bank was up 0.6% to $164.72 after a strong run this week.
Commonwealth Bank (ASX)
The stock reversed hard off a new closing record last month after earnings to be hit by panic selling with the rest of equities on tariffs. A sell-off in US banks had added to pressure on the sector. The ASX’s financials sector had fallen following a slew of lackluster earnings results from banks including ANZ, Westpac and Bendigo Bank as profits from deposits and loans get crunched.
From there CBA bounced back to ATH in short order. Heading into ANZAC day the ASX had its best weekly gain this year. Banks extended gains with Westpac adding 1.1% to $32.04 and ANZ by 1.6% to $28.84. Commonwealth Bank was up 0.6% to $164.72 after a strong run this week.

Highlights – Emerging Markets Stocks
- Brazil’s Bovespa index jumped 3.9% (up 12.0%),
- Mexico’s Bolsa index surged 7.0% (up 14.6%).
- Turkey’s Borsa Istanbul National 100 index rose 1.2% (down 4.0%).
Global Stock Markets Performance This Week

Technical Analysis
Technical Analysis of key markets via KnovaWave
S&P 500
Daily: The SPX has traded like clockwork hitting the 78.6% extension right on cue into election.
Background: The move fueled by the violent ABC for the 5 waves up for SPX continue right into bottom of the median line to give us an (a) or C of a 4. with impulse after completing 5. Reversed hard with energy fueled from the power impulse down from near +1/8 ATH. On the way up (just like down) It accelerated after it broke the Tenkan through the rejected Kijun and then the Kijun to close back over the median and 8/8. Bulls this was a (ii) of a 5. Bears this is a a-b of a C off a completive V of degree. We watch if this low was a (iii), (a) or C. Will determine if sharp ABC completed off all-time highs. We have to respect the number of alternatives of degree of 5. With such trends keep it simple support is Tenkan and Kijun and watch for ABC. No fear is the driving element.

The break up was from above the 200dma. The balance from sharp reversal after the initial 3 wave down from the SPX wave 5 extension as Covid19 fed impulse accelerated under the Tenkan. From there we had seen the ABC or 1-2-3 spinning around the 61.8% of the move. Support began at the October 2019 lows. A manic wave 5 or 3 of some degree was a resolution for the ages. Note the 100% extension from the emotive element and MM levels when the spit kicks in. A manic wave 5 or 3 of some degree was a resolution for the ages. Note the 100% extension from the emotive element and MM levels when the spit kicks in
Weekly: The weekly confirms the daily sequence into the 78.6% extension.
Background: The reenergized SPX tripped in 3 to test recent break up at Tenkan from there we had had a powerful rally to ATH. Again notice what happened “Each new high has evolved after testing Tenkan key support which is the next line after Friday’s dump & minor bounce.” We watch for a spit of a spit Extensions are difficult to time, keep it simple.

Key for the impulse higher was the spit or retest of MM 8/8 and Tenkan San, which held with the previous highs and Tenkan. To repeat “We look for 3 waves down and reactions to keep it simple with the alternatives in the daily.” Keep an eye on the put/call ratio with recognition to the sheer size of contracts AND keep in mind the stimulus distortion. The spit per channel fractal and Adams rule launched back over the cloud where we were encased AND we back tested it. Watch if a spit or clear break support as Chikou rebalances
Dow Jones
NVIDIA (NVDA) and Sherwin-Williams (SHW) replaced Intel (INTC) and Dow Inc. (DOW) in the Dow Jones Industrial Average starting on Friday, November 8.

NASDAQ 100
The Nasdaq100 (NDX) declined 2.4% this week, closing at 19,281, only 56 points, or 0.3%, above the March 13th close. From March 13th lows to this week’s (Tuesday) high, the NDX rallied about 6%, a so far notably unimpressive rally from the previous steep one-month decline (from the 22,223 February 19th high). The Bloomberg MAG7 Index closed the week only slightly above March 11th intraday lows, with the S&P500 ending the week 1.4% off March 13th trading lows. At this critical market juncture, further weakness risks acute instability. – March 28
Background: Fuel was after it broke and held the weekly Tenkan to see a spit of a spit fail which is completive of 5 of some degree with Chikou rebalancing. From there we sold off right to Tenkan (as did SPX) and bounced hard Support Tenkan to Kijun. Watch Chikou for divergence for continuation or failure. Divergence with Russell also a clue.


Russell 2000
The small cap Russell RUT broke out of multi year flag and then spat the previous high. Unlike SPX and NDX we could not get to new ATH until near the end of this cycle after it got through Tenkan and Kijun on the bounce. This is the index showing more of the fast money crowd and is trading like it. Needs to get traction in here for bulls. Support +1/8 through 7/8 (cloud base)

US Stocks Watch
Investors (and algos) will focus on the conference calls and outlooks. Last quarter everyone expected the worse, we saw critical updates on production in coronavirus impacted regions and if there is extended halting of operations weighing on multi-nationals.
NVidia $NVDA
Nvidia Shares have been well poised for what happened over the Lunar New Year Weekend, they are up roughly 28-fold in the past five years. They had completed a potential double top spitting the 4.618 fib extension. That said timing the impulse is one of patience, discipline and usually hindsight.
The surprise here was it came over the Luna New Year break. The Chinese AI DeepSeek was listed for free and went top of the Apple & Google app stairs. Panic ensued and NVidia finished down 17% Monday, the biggest loss of market capitalization in history with a $560 billion evaporation. The Semiconductor index sank 9%. NVDA shares performed a dead cat bounce at best and closed 15.8% lower at the end of the week.
The impact was amplified given trading had boomed in products that allow investors to amp up bets on the world’s most popular equities, with investors pouring a record of more than $6.5 billion into such “single-stock ETFs”, vehicles that track just a single company but use derivatives to intensify bullish or bearish wagers. A major winner in this category was a fund from GraniteShares, which provides two times the daily returns of market powerhouse Nvidia Corp. The strategy, which trades under the ticker NVDL, saw assets explode to a peak of $6.7 billion in late November 2024, with returns in excess of 350% that year. Funds tracking MicroStrategy, Tesla Inc. and Coinbase Global Inc. have followed similar paths.
The move tracked by the KnovaWave extension model followed the announcement of NVDA 4/1 split come levels off the energy break NVidia hadn’t looked back with many gaps below until it hit the 2.618 target of the exhaustion phase. We saw another power move off the $200 retest (old $800) & earnings off $300 which retested. It is a clear leader of SOX SMH look for cues there and ABC failures for changes.

Apple $AAPL
Apple gently motored up to new ATH over the massive $160 then $170 thru to $180 gamma level to new ATH. These levels will be key energy levels. Support from previous highs, resistance now Fibs and Murrey Math levels. Remember the impact $AAPL has, at least short term on all the major indices.

Tesla $TSLA
In the second half, mom and pop then ditched financial companies en masse – only for the cohort to ride the “Trump trade” wave and become the S&P 500’s biggest gainers between July and November. And like many investors during the brief market crash in August, the retail crowd panic-sold some of their hottest assets, including Nvidia and Tesla – all at the lows. That proved painful. Shares of Elon Musk’s EV-maker, for example, have almost doubled since then.
Wrong-sided positioning like this has pushed the retail group’s gains this year to a mere 9.8%, according to Emma Wu, a quantitative and derivatives strategist at JPMorgan, and colleagues. That’s their second-weakest performance in any year when the index posted a positive return since 2015.

Exxon Mobil $XOM

Part B: Bond Markets
Highlights – Treasuries
April 23 – Bloomberg (Jana Randow, Mark Schroers and Lisa Abramowicz): “Bundesbank President Joachim Nagel said a strong US Treasuries market is good for everyone, even as investors have turned to German bunds. ‘It is not good news that there is a lot of doubt regarding the safe haven of US Treasuries,’ he told Bloomberg Television… ‘We need a good US Treasuries market. This is so important for the financial markets worldwide.’”
- U.S. Treasuries climbed to end the week, pressuring yields on longer tenors to their lows from Wednesday while the 5-yr yield settled at its lowest level in nearly three weeks.
- Treasuries remained at their best levels into the close, making for a solid finish to a week that saw some concerns about weak auction demand. Corporate debt had a solid finish to the week, lifting the iShares iBoxx Investment Grade Corporate Bond ETF (LQD 107.92, +0.50, +0.5%) and iShares iBoxx High Yield ETF (HYG 78.79, +0.09, +0.1%) to their best levels in about three weeks.
- Crude oil overcame overnight weakness, but still lost nearly $1/bbl for the week,
- U.S. Dollar Index rose 0.1% Friday to 99.51, adding 0.3% for the week.
- Total money market fund assets recovered $31.7 billion to $6.913 TN. Money funds were up $778 billion over 39 weeks (16.9% annualized) and $944 billion y-o-y (15.8%).
- Total Commercial Paper gained $7.5 billion to $1.401 TN. CP has expanded $313 billion y-t-d and $92 billion, or 7.0%, y-o-y.
- 2-yr: -3 bps to 3.76% (-4 bps this week)
- 3-yr: -3 bps to 3.76% (-4 bps this week)
- 5-yr: -4 bps to 3.88% (-6 bps this week)
- 10-yr: -4 bps to 4.27% (-6 bps this week)
- 30-yr: -3 bps to 4.74% (-6 bps this week)
- NB: At Close 4/25/25


Highlights – Federal Reserve
- Federal Reserve Credit slipped $2 billion last week to $6.680 TN. Fed Credit was down $2.221 TN from the June 22, 2022, peak. Over the past 293 weeks, Fed Credit expanded $2.953 TN, or 79%. Fed Credit inflated $3.869 TN, or 138%, over the past 650 weeks.
- Fed holdings for foreign owners of Treasury, Agency Debt added $2.2 billion last week to $3.295 TN.
- “Custody holdings” were down $60 billion y-o-y, or 1.8%.
Highlights – Mortgage Market
- Freddie Mac 30-year fixed mortgage rates dipped two bps this week to 6.81% (down 36bps y-o-y).
- Fifteen-year rates fell nine bps to 5.94% (down 50bps).
- Bankrate’s survey of jumbo mortgage borrowing costs had 30-year fixed rates down two bps to 6.94% (down 68bps).
- Per 4/25/25
“The Fannie Mae 30-year current-coupon spread to the 5/10-year blend widened 6 bps to +160 as the U.S. Treasury 10-year yield rose 11 bps to 4.29% and volatility rose. The spread was the highest in more than 13 months. Volatility was the highest in about 18 months.” April 11 – Bloomberg:
- “Mortgage rates slingshot higher as tariff uncertainty roils markets.”
- “Brutal Week Sees Junk Debt Refinancing Costs Double in 2025.”
- “Cracks Are Forming in CLO Market as ETFs on Record Selling Spree.”
- “Investors lose $25bn in leveraged ETFs in sector’s biggest meltdown.”
- “‘The World Is Different Now’: Market Convulsions Hit Wall Street.”
The Fed is effectively throwing additional fuel on historic speculative manias. Central banks have been adding liquidity to avoid systematic failure.
Global Bonds This Week

Highlights – European Bonds W/E 4/25/25
- Italian 10-year yields decline seven bps to 3.57% (up 5bps y-t-d).
- Greek 10-year yields fell eight bps to 3.29% (up 8bps).
- Spain’s 10-year yields declined five bps to 3.12% (up 6bps).
- German bund yields were unchanged at 2.47% (up 10bps).
- French yields dipped five bps to 3.19% (down 1bp).
- The French to German 10-year bond spread narrowed five to 72 bps.
- U.K. 10-year gilt yields dropped nine bps to 4.48% (down 9bps).
Highlights – Asian Bonds W/E 4/25/25
- apanese 10-year “JGB” yields rose five bps to 1.34% (up 24bps y-t-d).
Junk Bond Market Vulnerable..
Credit markets may be off panic levels but unease overhang after the extraordinary spike in Treasury yields early in April. Benchmark mortgage-backed securities yields surged 56 bps the week after to 5.91%, the largest jump since 2020. Junk bond yields were up 96 bps in seven sessions to 8.58%, trading to the high since October 2023. Junk bond yield spreads to Treasuries widened 119 bps in four sessions. Leveraged loan prices traded to lows since July 2023. CDS prices had their biggest moves since the March 2020 crisis – investment-grade, high yield, and bank CDS prices.
- Junk yields (Bloomberg High Yield) dropped 38 bps to 8.19%, having now retraced less than half the spike from the 7.62% yield on April 2nd. Junk yields ended February at 7.15%.
- The junk bond market opened for LNG developer Venture Global to price an upsized $2.5 billion deal, the first issuance in two weeks.
- After widening 119 bps in the four sessions ended April 8th to 453 bps, high yield spreads have narrowed 55 bps to end the week at 398 bps.
- Leveraged loan prices recovered 36 bps to 95.11 – after sinking 162 bps over the previous two weeks.
- High yield CDS declined six this week to 424 bps – after beginning the month at 375 bps (292bps on February 19th).
- per 4/18/25
“The US leveraged-loan market’s streak without a deal launch has reached record levels as tariff volatility crimped activity this month across primary credit markets… Wednesday marked the 14th consecutive session without a new loan, the longest no-launch streak since Bloomberg started to compile the data in 2013…” April 17 – Bloomberg (Caleb Mutua)
“Wall Street banks are stuck with $2.35 billion in debt for the buyout of Patterson Cos., the second time lenders have been left on the hook for a big financing package since the Trump administration triggered a global trade war.” April 17 – Bloomberg (Jeannine Amodeo, Aaron Weinman and Gowri Gurumurthy)
April 15 – Financial Times (Harriet Clarfelt): “A cornerstone of demand in the $1.4tn US junk loan market is under pressure to sell very risky debt… Collateralised loan obligation vehicles, which own roughly two-thirds of US riskier corporate loans, may need to slash exposure to weaker borrowers most vulnerable to tariffs and recession because of the potential threat of rating downgrades… The heightened pressure on CLOs is the latest sign of how fears that Trump’s tariffs could sharply slow US growth are rippling through the corporate debt market… ‘Whether it’s a recession, a mild recession, a slowdown in growth — at the minimum, we’re going to have a slowdown,’ said Roberta Goss, head of Pretium’s bank loan and CLO platform. ‘That will have implications across the credit markets — and in leveraged finance, that’s going to result in elevated defaults and elevated downgrades over the course of the next year.’”
That Wednesday’s close had muni (AAA) yields up 89 bps in three sessions, before ending the week 66 bps higher. Importantly, such dramatic yield spikes are indicative of markets seizing up. Debt markets including leveraged lending were essentially shut down. Worse yet, acute debt market stress was a global phenomenon.
Last week, 10-year yields surged 57 bps in Colombia, 49 bps in Turkey, 48 bps in the Philippines and Mexico, and 46 bps in Indonesia. EM currency losses, especially versus the surging Japanese yen, meant speculator pain and “carry trade” deleveraging. A Bloomberg headline: “Emerging Stocks Sink Most Since 2008 as Tariff Turmoil Deepens.” Down 13%, stocks in Hong Kong suffered their worst session since 1997. Major stock index losses included Taiwan down 9.7%, Japan 7.8%, South Korea 5.6%, and China 7.0%.
Part C: Commodities
Highlights This Week
- Bloomberg Commodities Index slipped 0.3% (up 3.9% y-t-d).
- Spot Gold dipped 0.2% to $3,320 (up 26.5%).
- Silver rallied 1.7% to $33.1102 (up 14.6%).
- WTI crude dropped $1.66, or 2.6%, to $63.02 (down 12%).
- Gasoline gained 1.0% (up 5%),
- Natural Gas sank 9.5% to $2.937 (down 19%).
- Copper rallied 2.2% (up 22%).
- Wheat dropped 3.4% (down 4%),
- Corn declined 0.7% (up 4%).
- Bitcoin surged $10,330, or 12.2%, to $94,830 (up 1%).


Agriculture Futures
Cocoa and coffee brought inflation to the consumers drinking and and eating habits as companies passed on the price rises.
Cocoa
Cocoa futures were the best performing in 2024, surging by 176% for the year. Since then, we have had a vicious pullback. of around a 1/3 or $4,000. Cocoa a great example of how controlled or limited surplus can determine price. Africa produces 60% of global cocoa and nearly half of the world’s cocoa comes from just two West African countries, Côte d’Ivoire and Ghana.

The surge in 2024 cocoa prices was due to political and weather disruptions in West Africa. The crops were already struggling thanks to underinvestment in cocoa farms with growers struggling to replant diseased trees.
Coffee
Coffee futures followed cocoa higher and was up 73% for 2024, reaching a 47-year high as markets grappled with persistent supply concerns in key growing regions. While it has corrected off those highs in 2025, not to the extent of cocoa. The premium bean, arabica futures price doubling in 2024. Extreme weather in Brazil and Vietnam affected supply whilst demand was pressured by booming demand in markets like China.

Orange Juice OJ


BDI Freight Index
- The Baltic Exchange’s dry bulk sea freight index, which tracks rates for ships carrying dry commodities, was up for a third straight session on Friday, rising 1.5% to a new high since April 7 at 1,373 points, on higher demand across all vessel segments. For the week, the BDI rose nearly 9%, notching its second straight weekly gain.
- The capesize index, which transports 150,000-ton cargoes like iron ore and coal, also advanced for the third day, rising 2.3% to 1,889 points
- Thee panamax index, which usually tracks vessels carrying 60,000-70,000 tons of coal or grains, rose for the eighth straight session, increasing 1.5% to 1,392 points.
- Among smaller vessels, the supramax index eased one point to 977 points.
- Source: Baltic Exchange 4/25/25

Metals

Copper
Copper is the bellwether industrial metal and moves on supply risks and hopes for global recovery in demand. Disruptions at major mines and Chinese plants which produce more than half of the world’s refined copper impact price.
February 26 – Bloomberg (Alfred Cang, Archie Hunter and Mark Burton): “The world’s top commodity traders are rushing to ship copper to the US from as far afield as Asia as Donald Trump’s threat of import tariffs on the metal creates a huge opportunity for profit. The gap between copper prices in the US and the rest of the world widened sharply after the president… ordered the Commerce Department to examine potential levies on the metal. On Wednesday, prices on New York’s Comex surged as much as 4.9% to trade more than $1,000 a ton above the London Metal Exchange benchmark, which rose 1.2% to about $9,500 a ton.”

Gold
Gold bullion continued its rise following the prior week’s new high of $3,237 per troy ounce, which was the biggest weekly gain (6.5%)since the early stages of the Covid-19 pandemic in March 2020. The rise came as the market panic unleashed by the US President’s trade war caused investors to pull back from US Treasuries, a haven in normal times, as equities nosedived and the dollar fell to three-year lows against the euro.
- “China saw an explosive surge in gold trading last week as the metal hit successive records and Sino-US trade tensions rose. The Shanghai Futures Exchange saw trading volumes of the precious metal hit the highest level in a year last week. That was thanks to investors and industry players — refineries, traders and retailers — that have ramped up hedging activities as global markets gyrate in response to trade policy changes in the US and China… The precious metal could reach $4,000 an ounce next year… amid a wave of purchasing by central banks and recession risks, according to Goldman Sachs…” April 14 – Bloomberg (Yihui Xie)
- Physical demand for gold has also been strong this week, and in China buyers are paying a significant premium for the metal over international spot prices, a sign of strong demand.
- UBS raised its gold price forecast last Friday for the second time this year, to $3,500 per troy ounce over the next 12 months, up from the $3,000 forecast made at the start of the year. “We expect additional demand from central banks, institutions and investors following current events,” UBS analysts wrote in a note to clients.

Gold hit record highs as inflation, safe haven, and Russia and China buying to avoid sanctions pushed it higher last year. The price rose against multiple currencies, including the U.S. dollar. The structural driver is higher demand from central banks, while a cyclical lift would come from flows to exchange-traded funds as the Federal Reserve cuts.

Energy
“President Donald Trump may be teeing up the worst conditions for the oil business so far this century, outside of the 2020 pandemic shock… The International Energy Agency just slashed its forecast for oil demand growth this year by 29% from last month’s projection, to just 730,000 barrels a day. Its initial projections for 2026 continue the theme, with even lower growth of just 690,000 barrels per day. Both figures would represent a slowdown from 2024 and the 20-year average annual increase of almost 1 million barrels per day…” April 15 – Bloomberg (Liam Denning)
Oil prices in 2024 traded in a relatively stable range given the world conflicts in energy supply related regions. Intraday Brent prices stayed within a $24/b range, between $68/b and $93/b the narrowest trading range since 2019. Adjusting for inflation, 2024 was the narrowest since 2003. A moribund world economy working against Middle East and Russian tensions. The selling has continued in 2025.
U.S. energy companies played the smart card pushing production higher familiar with the cycle of oil prices. Natural gas demand grew as did record U.S. production, we saw increased electricity consumption, driven by the AI mania.

US Crude Oil (WTI)

Daily: WTI Crude Oil gave back all its rally that evolved from retesting the pennant breakout last December after completing the correction in 3 waves. from there it has fallen to new lows and the upside burst has effectively rinsed short and trapped new speculative buyers with the market now rinsing them as it falls to test support. The market has behaved as expected as we have said being in a completive mode for bulls with the upside impulse, it was a question of degree on the topside, as it will be on the downside. Use the Murrey math 240/60 grid. Was oil completing a C or IV? Support is previous lows and the bull flag. The bear case is the high was a complete 5.

Weekly: WTI crude oil futures held the support line from July 2021, having plunged around 50% off 2022 highs. The market is now back testing it. The break to the topside of its sphere of influence to close out the quarter over Kijun and Tenkan failed, and which are now resistance. Risk support is the grid. Resistance weekly channel, Murrey Math levels and previous breaks (off monthly). Bear case is Wave 5 complete.
What we broke……. Crude Oil in the past quarter built a huge bull flag. We watch if the recent break was false, or we fail. Very clear pattern.
The key is crowd behavior to help tell the story which in energy is often around geopolitics. A great example of why we watch ABC corrections and from here we get the energy from the break being balanced. This move that was powered by 50 dma Tenkan spit of a spit – hence the fractal energies reverberations.
US Natural Gas (Henry Hub)
Daily: US Natural Gas futures are a great example of rebalancing mania. The market is still correcting the manic 5 post the Ukraine invasion and beyond. Since the breakdown of the correction channel with failed breakups we have continued to multi year lows in a pennant formation after holding the daily 1/8. We now look at our Adam’s theory fractal rules with fractal spits powering these moves lower. Two clear alternatives, we are correcting the highs 5 or that was a 3 and we go higher. Resistance is heavy: 2/8 and cloud above. Kijun, 50 dma and cloud. Support is previous lows. Important to watch how this energy was built for shape correlation.


Like the larger wave on the way up it accelerated through previous highs (flat topped triangle energy) and over the resistance at 8/8 and new highs. We successfully tested that break in a pennant ABC. Previous highs (flat topped triangle energy) and 8/8 and new highs underscore the structure that fed the move and is key longer term in the collapse lower.
Weekly: Natural gas has been busy correcting the past months when it blew through all levels of support after breaking the weekly 50wma and the Kijun gave a kiss of death. From there we formed an island reversal which has resolved to the topside, trapping shorts and bears. Recall it broke down out of the corrective channel (Wave 4 or IV) to new multi-year lows. The instability and volatility stem from the sharp reversals that have failed indicative of speculative fervor like the previous impulsive spikes. Support is the flat Kijun and Tenkans. Resistance the near highs and previous uptrend. Bulls need all the damage down to be rebuilt. Kijun became the accelerator given energy lower and now higher came from a clean break of the Kijun
Part D: Forex Markets
John Maynard Keynes, 1920: “There is no subtler, no surer means of overturning the existing basis of society than to debauch the currency. The process engages all the hidden forces of economic law on the side of destruction and does it in a manner which not one man in a million is able to diagnose.”
- For the week ended April 18, 2025, the U.S. Dollar Index recovered 0.2% to 99.471 (down 8.3% y-t-d).
- On the upside, the Brazilian real increased 2.2%, the Mexican peso 1.1%, the South African rand 0.8%, the Norwegian krone 0.4%, the New Zealand dollar 0.4%, the Australian dollar 0.3%, and the British pound 0.1%. The Chinese (onshore) renminbi increased 0.18% versus the dollar (up 0.17 y-t-d).
- On the downside, the Swiss franc declined 1.4%, the South Korean won 1.1%, the Japanese yen 1.0%, the Swedish krona 0.9%, the Singapore dollar 0.3%, the euro 0.3%, and the Canadian dollar 0.1%.
- March 11 – Bloomberg (David Finnerty): “Macro hedge funds are increasingly seeking currency option trades that exclude the dollar as they navigate the market turbulence stemming from worries about the US economy. Trades involving the euro and haven yen were in demand Monday. The two currencies were easily the most traded on The Depository and Trust Clearing Corp., involved in over half of all trades, as US tech stocks tumbled by the most since 2022. Option data shows long euro positions are the highest since 2020…”

Key Currencies Versus the US Dollar
Australian Dollar – AUDUSD
The Australian dollar traded towards a 5 year low in the New Year in a tumultuous week, it has continued lower after breaking a three-month low of US65.1¢ on news of a Donald Trump’s US election victory before rebounding to US66.51¢ on hopes of fresh China stimulus. The Aussie dollar had been correcting since completing a 5 at the psych 80 level to fall under the weekly cloud in emotive fashion. The Australian dollar fell to test of the August lows of 0.7106 with Omicron fears. When that double bottom support broke it retested the Murrey Math Levels. Resistance the Cloud, Tenkan and Kijun like many commodities. From there it has been a combination of a stronger US dollar, a collapsing Chinese economy & concerns over the US economy.

Japanese Yen – USDJPY
USDJPY is consolidating the break after weakness with Treasury yields to rush to +2/8 and channel convergence. It came a long way from that 108.00 massive support for dollar-yen back through the top of the flat-topped triangle at 151/152 whcih it spins around in 2025. Any change will come from the weekly Kijun. Use your USDJPY Murrey 7/8 8/8 grid for now. EURJPY AUDJPY will determine risk on/off.
Yen weakness provided key support to dollar melt-up dynamics with BOJ slow-motion “normalization” in a world of fast-moving dynamics. The dollar yen traded 160.17 this cycle, the first time above 160 since April 1990. Governor Kazuo Ueda on that move basically ceded the yen fragility issue to the Ministry of Finance (MOF), affirming it wasn’t in the BOJ’s purview. He conveyed little concern for yen weakness, while downplaying its inflationary impact. The market accordingly took the yen out to the woodshed.

Chinese Yuan – USDCNH
China has been battling a weak economy for years and has been flooding its economy with liquidity to no avail, the result, falling yields and a record low for the Yuan against the US dollar. So far it has been defended at a triple top.
“Doubts over US exceptionalism are giving China a much needed break from strongly defending its currency, as the yuan’s strength allows it to dial back support via its daily reference rate. The gap between the People’s Bank of China’s daily reference rate versus narrowed to 675 pips on Monday, the least since early December. While the so-called fixing remains near the strongest level since November, its smaller spread with estimates signals weakening official support for the currency.” March 10 – Bloomberg (Iris Ouyang)
To begin 2025 the onshore yuan weakened past the level that China had been defending throughout December. The yuan breached the psychological milestone of 7.3 per dollar for the first time since late 2023, amid concerns over China’s economic struggles and a widening bond yield discount to the US. The move came even as the central bank maintained its support for the currency with its daily reference rate that Friday.

February 26 – Reuters: “Chinese authorities are rolling out fresh measures to limit capital flight, including increased scrutiny of overseas investments, as the yuan currency comes under mounting pressure. President Donald Trump’s tariffs threats are heightening Sino-U.S. tensions and discouraging inbound foreign investment… China has increased scrutiny of overseas investments by domestic companies and their use of proceeds from Hong Kong share sales… Meanwhile, China’s commercial banks sold the most foreign exchange to their clients since July last month… The conversion ratio – a gauge that measures households and corporates’ willingness to sell dollars for yuan – fell to the lowest level in seven months. Xinquan Chen, an economist at Goldman Sachs, said the current account showed sizeable currency outflows in January.”
January 12 – Bloomberg: “China has ramped up its support for the yuan with tweaks to its capital controls and a vow to crack down on market disruption, after the currency dropped close to a record low against the dollar in offshore trading. The People’s Bank of China and other regulators pledged to strengthen their management of the foreign-exchange market, deal with any behavior that may disrupt the market and prevent the risk of a large move in the yuan… The PBOC also adjusted its rules for cross-border flows…, allowing firms and financial institutions to borrow more from overseas, which may help increase capital inflows and support the yuan.”
South Korean Won – USDKWN
The won has slightly appreciated so far this year after tumbling since October 2024 by a cumulative 12% depreciation to the dollar both on domestic political developments and external concerns related to a less dovish Federal Reserve and trade policy risks. It had dropped to its weakest level in 15 years.

Indonesia Rupiah – USDIDR
“Indonesia’s rupiah fell to its weakest level against the US dollar since the Asian financial crisis of 1998 over mounting fears about the policies of President Prabowo Subianto and their impact on the fiscal position of south-east Asia’s largest economy… Bank Indonesia, the country’s central bank, told the Financial Times that it had intervened in bond and currency markets on Tuesday ‘to ensure the stability of the rupiah exchange rate and maintain the balance of foreign exchange demand and supply, thereby maintaining market confidence’.” March 25 – Financial Times (Joseph Cotterill and A. Anantha Lakshmi)
The Americas
The Canadian dollar and Mexican dollar have weakened since the mention of Trump tariffs on the two countries.
Canadian Dollar – USDCAD
The Loonie has been in a steady downtrend since 2021, on yield pressures, weakening economic metrics and political uncertainty. The USDCAD hit a 3 year high in June and corrected that in 3 waves led by the AUD and NZD with oil price impacting direction from there the selling of the Loonie resumed. From there it broke the 2020 highs and tested 1.48 before reverting back on tariff gamesmanships in 2025.

Mexico Peso – USDMXN
Mexico’s currency is part of a carry trade that involves investors borrowing in currencies that have low interest rates, such as the Japanese yen or Swiss franc, and buying higher yielding ones such as the Mexican peso or, recently, the U.S. dollar. It has boomed in popularity as interest rates have diverged around the world and market volatility has stayed low. after the Mexican election this year the peso had a dramatic fall against the yen – it dropped 4.4% on that Monday in its biggest daily decline since the COVID-19 crisis.
The peso had climbed to the strongest in almost nine years driven by relatively high local interest rates and low currency volatility until, that sell off.

Brazilian Real – USDBRL
December 19 – Bloomberg (Martha Beck, Vinícius Andrade, Maria Eloisa Capurro and Leda Alvim): “As the currency craters in Brazil, thrusting the country’s markets into the international spotlight for the first time in years, a grim reality is setting in for top economic aides to President Luiz Inacio Lula da Silva. They are, they fear, powerless to do much to stop the panic… The central bank has ramped up intervention in currency markets to try to stem the losses amid what Governor Roberto Campos Neto called an ‘atypical’ outflow. It has stepped in either directly or through swaps almost every day for the past week, spending close to $14 billion to give some support to the real… On Thursday alone it sold $8 billion in back-to-back spot auctions — that’s the biggest daily sale of dollars since at least 1999, when Brazil adopted a floating exchange rate regime…”

Europe
Euro – EURUSD
The EURUSD is up 466 pips or -4.49% vs the USD in the trading week. That is the largest % move going back to March 2009
Euro continued to bump up against that downtrend line from 2020 and spinning around the 50% of that year’s panic sell. The euro trades in what seems like eternal flags in the channel. We watch if Kijun (pink) testing Tenkan (orange) creates any impulse as EURUSD consolidates under the cloud and break up level from 2022. Watch 3 waves to see development for continuation and for impulse off Chikou rebalance. Governed by EURGBP and Bund volatility.

British Pound – GBPUSD
The GBPUSD is up 342 pips or -2.71% vs the USD. The % change is the largest move since November 2022.
British pound rose in a classic rising wedge since its late 2022 spike classic retest until its daily break late 2024 which brought a weekly kiss of death. From there a weekly cloud break with magnet pulls of cloud twist after ABC correction – will need Tenkan to break through Kijun for more strength. The upcoming months will be heavy on UK data and EU, Ukraine speculation which could mean an eventful time for the British pound.

Swiss Franc USDCHF


Turkey Lire USDTRY
Political instability erupted in Turkey at the hand of its autocratic and antidemocratic president on March 19. The Turkish lira immediately collapsed 12%, though record ($9bn) intervention reduced the day’s loss to 3.2%. Turkey’s central bank boosted short-term rates two percentage points to 46%. Yet the lira’s 3.1% loss was the largest weekly decline in almost two years. Turkish stocks were slammed 16.6%, with “banking stocks experiencing their worst weekly drop since at least 2001” (Bloomberg). Turkey’s local currency bond yield spiked 293 bps to 29.16%. “Turkish Lira Rout Sours Lucrative Carry Trade.” “Turkey’s Erdogan Warns Opposition Over Calls for Mass Protests.”
March 28 – Bloomberg (Ugur Yilmaz): “Ekrem Imamoglu, the Turkish opposition figure whose detention this month triggered mass protests and a market selloff, criticized Western leaders for their muted response to his arrest. In a piece published in The New York Times…, President Recep Tayyip Erdogan’s main political rival accused the US and Europe of prioritizing geopolitical interests over democratic values. ‘Their silence is deafening,’ Imamoglu wrote of world governments. ‘Washington merely expressed ‘concerns regarding recent arrests and protests’ in Turkey. With few exceptions, European leaders have failed to offer a strong response.’”

Bitcoin
Bitcoin is the world’s biggest digital asset; it had already staged a remarkable comeback in 2023. Then in January the approval of US Bitcoin exchange-traded funds was a further catalyst for gains. Donald Trump’s victory in November turbocharged BTC, sparking a record-breaking rally over the $100,000 level. Along the way, traders poured more than $100 billion into the ETFs, paving the way for similar crypto-related investment vehicles. At the opposite extreme, activity in memecoins, which often trade for a fraction of a cent, exploded.
Trump galvanized the digital-asset community with promises to reverse a US crypto crackdown under President Joe Biden and make America the center of the industry. In the weeks after the election, he announced the newly created post of czar for AI and crypto, and named industry proponent Paul Atkins to replace crypto nemesis Gary Gensler at the Securities and Exchange Commission.
This year also set a record for US ETF fund flows, with Trump’s presidential victory giving already emboldened investors even more incentive to double down. Funds that track the S&P 500 took the most flows, one of this year’s most notable new entrants was BlackRock’s Bitcoin ETF drawing the third-most inflows this year.
Bitcoin traded this week to a new ATH $99,978, ending the week with 2024 gains of 132%. Since the election, Bitcoin has surged 43%, with Ethereum up 39%, Ripple 215%, Cardano 240%, Solana 54%, and Dogecoin 144%. Bloomberg’s monitor page has expanded to include pricing for 58 crypto currencies.
Bitcoin soared 10% to a record $75,959 (ended the week up 80% y-t-d) after the Trump election 2.0. Bitcoin is performing technically to perfection. Impulse begets impulse. To understand panic, understand greed. Bitcoin exploded higher following its correction impulsively upon completing 5 waves up at +2/8. Each Tenkan and Kijun tap saw an explosive kiss of death until we completed 3 waves to around 28,000. From there we have seen extreme volatility to a new record high and retest.

We have seen what you would expect from a 5-wave impulse peak and ABC correction, a violent correction and completion. Use Murrey Math levels for corrections and targets as algorithms control the herd here, support is the cloud and sharp ABC, 1-2 moves. From there prices agitated towards those ATHs as news of a Bitcoin ETF fueled the rally, sound familiar? But this time it wasn’t signaling we are in a 3 high probability but a 5.


On the Risk Radar

Geopolitical Tinderbox Radar
The Week Ahead – Have a Trading Plan
Watch Earnings, Central Bankers and Geopolitics speeches, reports and rate moves.
Next Week’s Risk Dashboard
Global Week Ahead Highlights
- Markets during Trump’s first 100 days compared to other Presidents
- Trading the Canadian election? Volatility rules over feigned directional calls
- Gauging the odds of a Canadian election surprise…
- …and how a minority would be more untenable than usual
- The Canadian election only starts the clock on market effects…
- …as the focus shifts to highly uncertain trade and fiscal policies
- Canadian GDP: So long resilience, we barely knew ye!
- US nonfarm and PCE will begin to test the Fed’s dual mandate
- US GDP: Unusually wide-ranging expectations
- The BoJ’s patient hike bias may be misplaced
- BCRP likely to remain on hold
- BanRep: Did the prior vote tee up a cut?
- BoT: Shaken, but stirred?
- China’s PMIs may signal the beginning of downsides
- US vehicle sales likely to soar as ISM-mfrg weakens
- Eurozone CPI may remain supportive of the ECB’s easing bias…
- …as Eurozone inflation risk is starkly different to US inflation risk
- Eurozone GDP to post soft growth before harsher reality sets in
- Aussie inflation may test RBA pricing after hot jobs
US Economic Highlights
- Monday: Nothing of note
- Tuesday: Advance March International Trade in Goods (prior -$147.9 bln), advance March Retail Inventories (prior 0.1%), advance March Wholesale Inventories (prior 0.3%) at 8:30 ET; February FHFA Housing Price Index (prior 0.2%) and February S&P Case Shiller Home Price Index (consensus 4.7%; prior 4.7%) at 9:00 ET; April Consumer Confidence (consensus 88.3; prior 92.9) and March Job Openings (prior 7.568 mln) at 10:00 ET
- Wednesday: Weekly MBA Mortgage Index (prior -12.7%) at 7:00 ET; April ADP Employment Change (consensus 128,000; prior 77,000) at 8:15 ET; Q1 Employment Cost Index (consensus 0.9%; prior 0.9%), advance Q1 GDP (consensus 0.4%; prior 2.4%), advance Q1 GDP Deflator (consensus 3.1%; prior 2.3%), March Personal Income (consensus 0.4%; prior 0.8%), Personal Spending ( consensus 0.4%; prior 0.4%), PCE Prices (consensus 0.0%; prior 0.3%), and Core PCE Prices (consensus 0.1%; prior 0.4%) at 8:30 ET; April Chicago PMI (consensus 46.0; prior 47.6) at 9:45 ET; March Pending Home Sales (consensus -0.2%; prior 2.0%) at 10:00 ET; and weekly crude oil inventories (prior +244,000) at 10:30 ET
- Thursday: Weekly Initial Claims (consensus 225,000; prior 222,000) and Continuing Claims (prior 1.841 mln) at 8:30 ET; Final April S&P Global U.S. Manufacturing PMI (prior 50.2) at 9:45 ET; March Construction Spending (consensus 0.3%; prior 0.7%) and April ISM Manufacturing Index ( consensus 47.9%; prior 49.0%) at 10:00 ET; and weekly natural gas inventories (prior +88 bcf) at 10:30 ET
- Friday: April Nonfarm Payrolls (consensus 130,000; prior 228,000), Nonfarm Private Payrolls (consensus 125,000; prior 209,000), Average Hourly Earnings (consensus 0.3%; prior 0.3%), Unemployment Rate (consensus 4.2%; prior 4.2%), and Average Workweek (consensus 34.2; prior 34.2) at 8:30 ET; and March Factory Orders (consensus 4.1%; prior 0.6%) at 10:00 ET
Bond Market Highlights
- Monday: 13-, 26-week bills; 14-day cash management bills
- Tuesday: 6-week bills; three-year notes
- Wednesday: 17-week bills; T
- Thursday: 4-, 8-week bills;
Central Bank Highlights
Four central banks deliver policy decisions this week. None of them are likely to be influential to the global market tone. One major, and three regional central banks are on the docket.
Bank of Japan—A Patient Hike Bias
The BoJ statement at around 10:30pmET on Wednesday night will be followed by Governor Ueda’s press conference at around 2:30amET Thursday. Consensus and markets are unanimously positioned for no policy change.
A hike bias would have recent inflation on its side. Tokyo CPI was hotter than expected at 3.5% y/y (3.3% consensus) and 3.1% excluding food and energy (2.8% consensus). The month-over-month gain in CPI ex-f&e was 4.9% SAAR again for the hottest back-to-back readings in two years (chart 21).
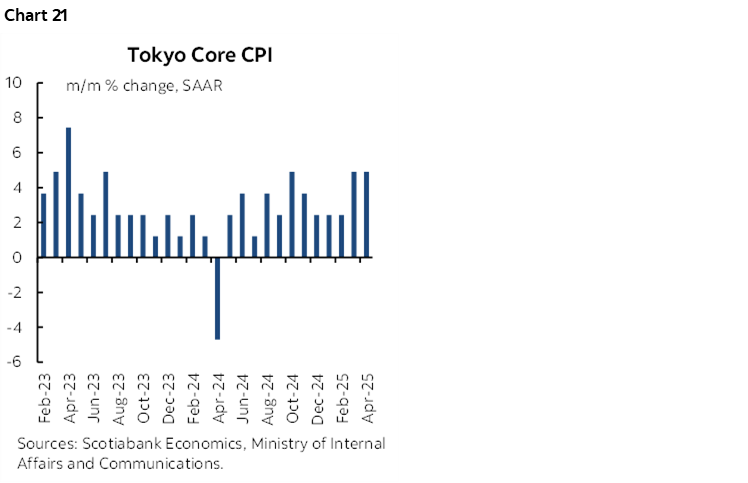
And yet Governor Ueda has set expectations rather low for this meeting. He recently said “We want to closely monitor data related to the impacts of tariff measures and their mechanism in particular. We will carefully watch how the likelihood of realizing our outlook changes without preconception and make appropriate policy decisions.”
The BoJ will refresh its forecasts including for inflation and growth at this meeting. High uncertainty is likely to be conveyed and with that the absence of anything other than general guidance that eventually another hike could be delivered if all goes well.
So, is all going well? From an inflation drivers’ standpoint, I’d have to say not so much. The yen’s 11% appreciation to the dollar since last July’s trough and the roughly $15/barrel drop in WTI oil prices over a similar period threaten less pass-through risk into Japanese core inflation and hence renewed disinflationary pressures. Shunto wage negotiations have yielded strong successive results for the less than one-fifth of affected Japanese workers, but real average wages remain weak. Trade wars led by the US combined with little Japanese reaction and the low likelihood of a trade deal anytime soon are likely to create further disinflationary pressures. All together, the BoJ should tread carefully on further rate hikes—backward-looking inflation notwithstanding.
BCRP—Still on Hold
Chile’s central bank is expected to hold its overnight rate unchanged at 5% on Tuesday. It stopped easing after the cut in December and pivoted toward emphasizing inflation risk while raising its forecast. Total CPI inflation has been trending mildly higher for some time now and presently sits just below 5%. Monitoring the influences of US-led trade wars is likely to continue to dominate uncertainty over next steps.
BanRep—How Revealing was the Prior Vote?
Most economists expect Colombia’s central bank to leave its overnight rate unchanged at 9.5% on Wednesday. Our LatAm economists are part of a minority that is expecting a 25bps rate cut. Part of the case for a cut is that the Board narrowly voted 4–3 in favour of a hold versus a 50bps cut at its last meeting, revealing a significant minority in favour of continued easing. There is also political pressure on the central bank to cut.
BoT—Shaken, but Stirred?
The Bank of Thailand is forecast to cut its benchmark rate by 25bps on Wednesday. Consensus is not unanimous as a significant minority expects a hold. What may stir the central bank to cut again are the US-led global trade war and a major earthquake.
Commentary via Scotiabank
US Earnings Highlights
The upcoming week Q1 earnings season brings on heavyweights such as
- Tech includes four of the Magnificent 7—Apple (AAPL), Microsoft (MSFT), Amazon (AMZN), and Meta Platforms (META) Plus Snap (SNAP), Roku (ROKU), Spotify (SPOT), Twilio (TWLO), Airbnb (ABNB), Roblox (RBLX), Etsy (ETSY), and Lumen Technologies (LUMN).
- Payments and fintech sector with results from PayPal (PYPL), Block (XYZ), Visa (V), Mastercard (MA), and QUALCOMM (QCOM), alongside NXP Semiconductors (NXPI) from the chip space.
- Healthcare with Pfizer (PFE), Moderna (MRNA), Eli Lilly (LLY), Amgen (AMGN), Teladoc Health (TDOC), Regeneron (REGN), Biogen (BIIB), AstraZeneca (AZN), GSK (GSK), Novartis (NVS), Organon (OGN), and CVS Health (CVS), along with REITs Omega Healthcare (OHI) and Annaly Capital (NLY).
- Consumer earnings from Coca-Cola (KO), McDonald’s (MCD), Starbucks (SBUX), Altria (MO), and Kraft Heinz (KHC)
- Financials earnings from SoFi Technologies (SOFI), Ares Capital (ARCC), Prudential Financial (PRU), and Robinhood (HOOD). Real estate and REIT names W. P. Carey (WPC), VICI Properties (VICI), STAG Industrial (STAG), Crown Castle (CCI), and Iron Mountain (IRM)
- Industrials and transport results from UPS (UPS), Caterpillar (CAT), General Motors (GM), Honeywell (HON), and Waste Management (WM)
- Energy names Transocean (RIG), ExxonMobil (XOM), Chevron (CVX), BP (BP), EOG Resources (EOG), Dominion Energy (D), Southern Company (SO), Enterprise Products Partners (EPD), ONEOK (OKE), Albemarle (ALB) First Solar (FSLR) Expand Energy Corporation.
- American Tower (AMT), DuPont (DD), Corning (GLW), and Booking Holdings (BKNG)
- Monday: NXP Semiconductor (NXPI) Transocean (RIG), Waste Management (NYSE:WM), Welltower (WELL), Two Harbors Investment (TWO), Teradyne (TER), NOV (NOV), Domino’s Pizza (DPZ), Kandi Technologies Group (KNDI), Leggett & Platt (LEG), InMode (INMD), Cadence Design Systems (CDNS), F5 Networks (FFIV), Alliance Resource Partners, L.P. (ARLP),
- Tuesday: Pfizer (PFE) PayPal (PYPL), Visa (V), Altria Group (MO), Coca-Cola Company (KO), Starbucks (SBUX), Enterprise Products Partners L.P. (EPD), General Motors (GM), BP p.l.c (BP), Snap (SNAP), W. P. Carey (WPC), Kraft Heinz Company (KHC), United Parcel Service (UPS), SoFi (SOFI), Ares Capital (ARCC), American Tower (AMT), Honeywell International (HON), Corning (GLW), First Solar (FSLR), Regeneron Pharmaceuticals (REGN), STAG Industrial (STAG), Spotify Technology S.A. (SPOT), ONEOK (OKE), Booking Holdings (BKNG),
- Wednesday: Microsoft (MSFT) Meta Platforms (META) QUALCOMM (QCOM), Caterpillar (CAT), Annaly Capital Management (NLY), Teladoc Health (TDOC), Etsy (ETSY), Prudential Financial (PRU), GlaxoSmithKline (GSK), Western Digital (WDC), Crown Castle International (CCI), eBay (EBAY), Albemarle (ALB), Bausch Health Companies (BHC), Norwegian Cruise Line Holdings (NCLH), VICI Properties (VICI), Brookfield Infrastructure Partners (BIP), Tanger Factory Outlet Centers (SKT), MGM Resorts International (MGM), Automatic Data Processing (ADP), AFLAC (AFL), Metlife (MET), PPL Corporation (PPL),
- Thursday: Apple (AAPL) Amazon.com (AMZN) CVS Health (CVS), Mastercard (MA), McDonald’s (MCD), Roku (ROKU), Organon (OGN), Moderna (MRNA), Airbnb (ABNB), Twilio (TWLO), Amgen (AMGN), Iron Mountain (IRM), Omega HealthCare Investors (OHI), Lumen Technologies (LUMN), Southern Company (SO), Roblox Corporation (RBLX), Biogen (BIIB), Eli Lilly & Co. (LLY), Riot Platforms (RIOT), Sundial Growers (SNDL), United States Steel (X), SiriusXM Holdings (SIRI), Strategy (MSTR), Block (XYZ),
- Friday: ExxonMobil (XOM), Chevron (CVX), Shell (SHEL), DuPont (DD), fuboTV (FUBO), T. Rowe Price Group (TROW), Brookfield Renewable Partners (BEP), CIGNA (CI), Eaton (ETN), Fulgent Genetics (FLGT), Magna International (MGA), ArcelorMittal (MT),
US IPO Week Ahead
Two IPOs are set to list in the week ahead, although some deals may move around the calendar at the last minute.
- Aerospace and defense company AIRO (AIRO) is tentatively scheduled to raise $75 million at a $381 million market cap. AIRO’s business is organized into four operating segments: Drones, Avionics, Training, and Electric Air Mobility. The company saw strong growth and margin improvement in 2024, though it relies heavily on government customers for revenue.
- Chinese insurance distributor Yuanbao (YB) plans to raise $28 million at a $683 million market cap. The company specializes in personal life and accident and health insurance. Yuanbao collaborates with 46 insurance carriers, offering a diverse portfolio of insurance products, including medical, critical illness, and life insurance.
Source: Renaissance Capital
Focus on yourself and what YOU CAN INFLUENCE, set your trading plan and goals in be set for 2025.
Trade Smart!
Subscribe and Follow
Find us at www.traderscommunity.com
Real Time Economic Calendar provided by Investing.com.
Follow our contributors on Twitter @traderscom @thepitboss16 @knovawave @ClemsnideClem
Note these charts, opinions news and estimates and times are subject to change and for indication only. Trade and invest at your own risk.
Trade Smart!
Focus on yourself and what YOU CAN INFLUENCE, set your trading plan and goals in be set for 2025.
-comment section below data-
Subscribe and Follow
Find us at www.traderscommunity.com
Follow our contributors on Twitter @traderscom @thepitboss16 @knovawave @ClemsnideClem
Note these charts, opinions news and estimates and times are subject to change and for indication only. Trade and invest at your own risk.
Trade Smart!