The year 2004 has been one heck of a ride, one has to ask has the Santa rally come early and is Santa drunk? No really … Bitcoin over $100,000, endless run higher of S&P 500 and the Nasdaq with multiple several new record highs in the process holding their bullish disposition after a November employment report soothing the soft landing/no landing view t with the market hopeful about earnings growth and another rate cut at the December 17-18 FOMC meeting. Let’s not forget Tesla and NVidia and their run.
Meanwhile it seems distractions get louder; mass drone sightings over New Jersey, aliens’ invasion, Secret government operation to find WMDs, control the airspace. Syria and the rest of the Middle East crashing from one disaster to another, then we have political chaos in France, Germany and south Korea grinding on. Let’s not forget the Putin seven-day war that has dragged on for two years plus. Maybe Santa has the right idea get drunk, the markets are acting likewise. Why we have strict trading rules here based on psychology, math, experience and avoiding false narratives and dribble out there.
That said pay attention to the time of year, the bonus pay dates (no we aren’t being cynical), tax markings and look the previous run ups into Dec 31. Don’t let the grifters out their sway you, VIX is historically low, what does that tell you? Protection is cheap and the market is complacent with no fear. Here endeth the lesson.
The punters appear all in, recall just last week Money Market Fund Assets (MMFA) expanded last week was the largest since the March 2023 banking crisis, the week ended March 15th. The MMFA surged $95.9 billion last week to a record $6.771 TN. MMFA were up $637 billion, or 30% annualized, over the past 18 weeks, with y-t-d growth of $885 billion, or 15.9% annualized.
We have seen a spectacular monetary inflation, MMFA inflated $2.212 TN, or 49%, since the Fed commenced “tightening” in March 2022, and $3.137 TN, or 86%, since the start of the pandemic (Feb. ’20). Notably 78% ($74.5bn) of last week’s expansion and 75% ($474bn) of the 18-week surge are shown by growth in institutional money funds (as opposed to retail). This is a reflection of the repo market “basis trade” leveraging and securities finance more generally (intermediated through institutional funds). This is why the carry trade is so influential in price action.
Before all this U.S. equities inflated $5.812 TN during Q3 to a record $91.720 TN. One-year growth of $21.105 TN, or 29.9%, compares to 2003’s pre-2008 crisis annual record gain of $4.385 TN. Over the past five years, Equities inflated $40.950 TN, or 80.7%. At 312%, Q3’s Equities-to-GDP ratio compares to previous cycle peaks 187% (Q3 2007) and 210% (Q1 2000).
May peace be with you. We have the last Fed FOMC in the week ahead, be aware and position accordingly.
Mega-cap stocks dominated again. The Nasdaq Composite closed above 20,000 for the first time this week and ended 0.3% higher on the week. For the week however the S&P 500 dropped 0.6% and the Dow Jones Industrial Average dropped 1.8%. The Russell 2000 was unable to carryon after setting new highs losing 2.6%. Double top worries? Yearend profit-taking activity is alive and well from experienced traders and insiders alike. We always geta laugh from dribblers questioning why insiders sell at such extended levels, really?
U.S. Inflation heading into the next FOMC was the major data event. Wednesday’s release of the November Consumer Price Index (CPI) met expectations and reinforced the market’s anticipation of an upcoming rate cut. Total CPI moved higher on a year-over-year basis to 2.7% from 2.6% and core CPI was at 3.3%, which is still above the Fed’s 2% inflation target.
Thursday’s release of the November Producer Price Index (PPI) report showed rising inflation at the producer level, which is against the market view of ongoing rate cuts. The index for final demand was up 3.0% year-over-year versus 2.6% in October. The core index for final demand was up 3.4% year-over-year (3.45% unrounded versus 3.37% in October).
We also had weekly initial jobless claims, which increased to 242,000 from 225,000 and continuing claims, which increased to 1.886 million from 1.871 million.
Bonds responded with the 10-yr yield jumping 25 basis points to 4.40%, the largest weekly jump since October 2023. The 2-yr yield jumping 14 basis points to 4.24%. Benchmark MBS yields rose 30 bps to 5.69%. With overheating risks rising and Team Trump ready to hit the ground running next month.
Bonds were under pressure globally. Despite another ECB rate cut:
Yields jumped 20 bps in Italy, 19 bps in Portugal, 17 bps in Greece and Spain, 16 bps in France, and 15 bps in Germany.
Dollar-denominated yields were up 28 bps in Peru, 21 bps in Mexico, 21 bps in Chile, and 14 bps in Brazil.
Local currency yields were 33 bps higher in Colombia, 18 bps in Cyprus, and 16 bps in Poland.
The fed funds futures market now sees a 95.3% probability of a 25 basis points cut next week, up from 86.0% one week ago, according to the CME FedWatch tool.
Earnings wise we are seeing some air come out of the software Tech bubble, Oracle (ORCL) fell 9.6% this week after a disappointing fiscal Q2 earnings report, missing consensus EPS estimates compiled by FactSet, and warning on lower-than-expected guidance for fiscal Q3. Adobe’s (ADBE) FY25 guidance also disappointed investors. However, Broadcom (AVGO) soared 25.2% this week after solid results and pleasing guidance.
Europe Floundering
As expected, the ECB cut its key policy rates by 25 basis points, as expected. European Central Bank policymakers spoke in favor of additional rate cuts.
Germany
Bundesbank lowered Germany’s growth forecast for 2025 to 0.2% from 1.1% while the outlook for 2026 was trimmed to 0.8% from 1.4%. The CPI forecast for 2025 was lowered to 2.4% from 2.7% while the outlook for 2026 was reduced to 2.1% from 2.2%. Germany’s Chancellor Scholz is set to face a confidence vote on Monday that he is expected to lose.
France
In an unscheduled announcement early Saturday morning, the rating agency Moodys lowered France’s long-term issuer rating from Aa2 to Aa3, blaming political instability that will make it difficult to tackle the national deficit. France’s finances will be “substantially weakened” in the coming years, it said underlining the economic challenges facing new prime minister François Bayrou. Bayrou faces difficult parliamentary arithmetic with the country’s parliament fractured into three blocs after this summer’s legislative elections.
“There is now very low probability that the next government will sustainably reduce the size of fiscal deficits beyond next year. As a result, we forecast that France’s public finances will be materially weaker over the next three years compared to our October 2024 baseline scenario,” the agency said.
S&P Global Ratings downgraded France’s credit rating in May from AA to AA-, equivalent to Moody’s Aa3 rating. Fitch kept its rating at AA- in October but lowered its outlook from stable to negative, a precursor to a downgrade if improvements are not made.
France had a deficit of 5.5 per cent in 2023, the second highest in the Eurozone after Italy, according to EU figures. Moody’s expects this to reach 6.3 per cent in 2025 before gradually decreasing to around 5.2 per cent in 2027.
France’s debt-to-GDP ratio would increase from 113.3 per cent in 2024 to 120 per cent in 2027, the agency predicted.
France has already been reprimanded by the European Commission for breaching an annual borrowing limit of 3 per cent of GDP, as part of efforts by Brussels to bring debt levels under control across the EU.
Moody’s said that France has significant credit strengths and a diversified economy. But there is a risk of a “durable increase” in the cost of financing the country’s debt that could create a “negative feedback loop between higher deficits, a higher debt load and higher financing costs”.
Bayrou’s first task will be to ask parliament to pass an emergency stop-gap budget law in order to avoid a shutdown of government services until a new budget can be passed next year. The centrist politician is in the process of appointing his government.
Outgoing caretaker finance minister Antoine Armand said he “takes note” of the Moody’s downgrade. “The appointment of Prime Minister François Bayrou and the reaffirmed desire to reduce the deficit provide an explicit response to this,” he said.
Year to Date:
Nasdaq Composite: +32.7% YTD
S&P 500: +26.9% YTD
S&P Midcap 400: +17.8% YTD
Russell 2000: +15.8% YTD
Dow Jones Industrial Average: +16.3% YTD
Week Ahead Catalysts
The coming week brings a slew of Central banks latest monetary policy decisions in the last full week before the holiday season and year-end. Central banks including the Fed, BoJ and BoE are out with their decisions. We also will see several Latin American, European and Asian central banks in what is likely to be a highly guarded stance into 2025. BoC Governor Macklem will also make a key speech of what he may seek in the five-year mandate review follows this past week’s decision.
Data wise major inflation reports from the US, Canada, UK and Japan will combine with global PMIs, retail sales reports from the US, Canada and UK, plus UK jobs and wages to offer elevated data risk.
With all that we have the French political quagmire, the collapse of the Assad government in Syria and the aftermath of the failed South Korea 2-hour military takeover.
Where now after the Trump Win & the FOMC?
via Bloomberg
A reminder wealth inequalities become only more pronounced late in the cycle, creating a sprawling divergence between market euphoria and deepening public dissatisfaction. Political class market embracement and accommodation shifts to the appeasement of ever more powerful populist movements. Markets this week at least acknowledge the unfolding power-shift to disgruntled electorates. and voters. In opportune times you need to be flexible and wait like a cobra to strike. There is a number of reasons why Warren Profit has accumulated so much cash heading into these results.
While we are all aware politicians don’t keep promises the “deficits don’t matter” is at precarious extremes. Such profligacy is a dangerous consequence of repeated Fed market bailouts and the resulting subversion of market discipline. One looks towards Elon Musk’s cost cutting if Trump wins as something no one believes, if true, government jobs appear vulnerable given that has been the bulk of the Biden hiring’s recent gains.
Ahead we have Iran’s faux war threats sauced with more anti-western rhetoric and some potential risk to energy markets. Putin and Isreal eye their next moves as they watch on the future of US leadership be unveiled. Through in key central bank meetings and earnings, a busy few months lie ahead.
Two paths to bankruptcy: gradually and suddenly. – Ernest Hemingway
Our basic assumption throughout this most protracted credit bubble was that market discipline would eventually win the day. It has been an incredibly long wait. And we all know the pitfalls of asserting “this time is different.”
Oh, the debt and spending. The US federal government ran a $1.8 TN deficit last year, or almost 7% of GDP. Most analysts believe the deficit only grows from here. There are reasonable scenarios where it spirals out of control. Paul Tudor Jones has stated the issue concisely: “We are going to be broke really quickly unless we get serious about dealing with our spending issues.”
Also grabbing our attention is the continuing woes and distractions in China and the unstable emerging markets. The bond markets in the U.S. are also depicting risk adverse behavior. Endless supply coupled with an elevated deflation risk weighing on market sentiment globally
Europe remains on the radar. The euro continued to drift lower to its weakest in about a month, under-performing its major peers. French President Emmanuel Macron and German Chancellor Olaf Scholz both have suffered humiliating reverses in the past months. Lord knows what is going on in the UK.
Much of this is climbing the wall of worry, FOMO and in the US, households have an abundance of excess savings and high liquidity. These are all factors we watch in our risk matrix. Remember the stock market is not the economy, the stock market is a mountain of human emotion guided by greed and fear.
In Q3 2024 U.S. household Net Worth (Assets less Liabilities) inflated $4.766 TN (11.6% annualized) to a record $168.800 TN, with one-year growth of $17.277 TN, or 11.4%. For perspective, Net Worth inflated a then record $4.006 TN in 1999, and a mortgage finance Bubble high of $6.871 TN in 2004.
The pre-pandemic record was set with 2019’s $12.710 TN increase. Net Worth inflated $49,873 TN over 17 quarters, or 42%. There’s no mystery surrounding the ongoing pump.
Chart 1 Difference between total household net worth today minus what a simple, stable trend line fitted to the pre-pandemic era would have predicted to happen to net worth by now. Chart 2 shows the cumulative change in household net worth by now compared to a trend line; American households have about US$18.9 trillion in ‘excess’ net worth. via Scotiabank
Where is the Fear in Instability?
Compressed risk premiums and CDS prices are indicative of complacency. Markets behave this way when there is some underlying monetary disorder (dislocation in liquidity creation).
What all this does for markets is keep risk measures on, we see in the vicious VIX fails and short-term option volumes. It is when the risk avoidance measures, or tolerance fails this can trip up the whole structure of buying and cycling through risk assets.
Leveraged speculation, including “basis trades,” “carry trades” and run deep and why the yen and Mexican peso are deeply relevant to this whole structure.
In the backdrop we have war abroad in the Ukraine and Middle East, unsettled relations between Taiwan and China. At home in the US universities and cities to the North have become a quagmire of protest, illegal immigration placement and political vitriol that have deeply divided these regions. The cost of living through it all has sent many working through middle class families to the brink and beyond, insurance costs have risen over 100% in a year in some cases to name just one inflation cost that politicians lie about.
While complacency reigns supreme in equities whilst bonds are awake to the risk out there. The MOVE (bond volatility) Index rose another five the week prior to the election, to a one-year high 133. The VIX for its’ part was crushed after the election.
“We have a market trying to interpret the Fed who is trying to find out how they can interpret their long-only portfolio at a risk parity where rates cannot rise.”– MoneyNeverSleeps
Our weekly reminder for risk, timely given the V shape to ATH in just a week. The downside is clear with the absence of moral hazard from repeated Federal Reserve market bailouts in an environment of some would say obscene liquidity pumps. Pure greed is the other part, not wanting to miss out on fees. The obvious question is, how deeply ingrained is this attitude through the markets? How do we ween the markets off this continuous dip feed? At this point the Central Banks have kicked that answer down the road.
Our take remains the Fed is not just focused on inflation but risks such as the commercial real estate debacle. the high US dollar and the massive Federal debt refunding cost.
We need to grasp all the risks to be wary of but not ignore price reaction. We always talk here about expect the unexpected and now that is front and center, gage the market’s reaction, the market is always right and that’s why we focus on the crowd psychology aspect.
Unsuspecting investors in their millions have or will lose meaningful amounts of their savings. They bought into the mania, threw caution to the wind, and will suffer the consequences regardless of the warnings of unsustainability. The reason we started TradersCommunity was for situations like this many moons ago. Beware of those ‘experts’ who never saw the sell off and chided you for believing it now claim to be gurus measuring risk. It’s a bit late when some of these stocks and markets are down 50-90%. Beware of those who claim long term investment when it all goes wrong. Anyhoo..
Oh China
Xi Jinping promised to spend whatever it takes to reach growth targets as he tapped the reflation panic button. A Reuters article placed Beijing’s stimulus at $1.4 TN. On top of a system locked in massive credit expansion, upwards of $5 TN annually. He is pushing hundreds of billions to the stock market, hundreds of billions to the festering local government sector, hundreds of billions to the to attempt to arrest the slide in the apartment markets.
November 21 – Wall Street Journal (Brian Spegele): “On his first day in office, leader Xi Jinping inherited an ambitious road map to build 10,000 miles of high-speed rail to link China’s biggest cities. He took those plans and supersized them. What has emerged 12 years later is one of the biggest public works in history, soon to exceed 30,000 miles of high-speed rail… It’s becoming a giant money pit. China has spent more than $500 billion on new tracks, trains and stations in the past five years, while the country’s national railway operator, China State Railway Group, is nearing $1 trillion of debt and other liabilities. Just keeping up with its debt requires $25 billion annually.”
November 19 – Financial Times (Kaye Wiggins, Cheng Leng and Arjun Neil Alim): “Goldman Sachs’ chief executive has warned that global investors are still ‘predominantly on the sidelines’ over deploying capital in China because of weak consumer confidence and difficulties getting money out of the country. David Solomon said investors ‘continue to be concerned’ about cashing out of investments in the world’s second-largest economy. ‘It’s been very difficult over the course of the last five years to get capital out,’ he told an event… organised by the Hong Kong Monetary Authority… ‘I think you’ve got a combination of issues that have global investors predominantly on the sidelines with respect to capital deployment,’ Solomon said.”
Any pushback to fledgling tightening these days ensures excessively loose financial conditions.
The massive liquidity out there stems the downside and promotes the upside until then. Let’s not forget the carry trade adding to the mix with the yen and Mexican peso at the fore front there. These elements popping out of the risk acceptance matrix and the clues going forward for a bit.
With all the redirection of blame at the Fed about inflation one has to understand it is a global phenomenon outside the Fed’s Control. With the war drums louder than ever the supply chain issues are out of control. The Federal Reserve is not in control of global energy and commodities prices. Another important aspect is the Fed doesn’t Control corporate pricing or wage decisions. Let us be clear geopolitical, climate change developments and what an out of depth, politically motivated administration are outside the Fed’s sphere of influence.
The question investors have to ask is what he can do to inflation given most of it is supply driven or some would see political managed inflation. The Fed does not have the tools for and how quickly can consumers and businesses alike recalibrate from supply chain issues? The continuing war drums from Biden. Has wag the dog from Biden crossed your mind?
Geopolitical Tinderbox
Middle East Risk Monitor
The US consumer has delivered but delinquency rates are rising for several credit categories. Looking deeper much of this has been more about normalization toward pre-pandemic patterns compared to when extreme policy supports, and very low rates meant little to no default activity in the pandemic. Scotiabank points out that “We are at a twenty-three year low in the debt-to-disposable income ratio and still toward record low debt service payments to incomes remain supportive of spending and lessen rate sensitivity compared to, say, strained measures into the GFC. The personal saving rate has normalized, but the stock of outstanding cash and checkable deposits on US household balance sheets remains very elevated “
What’s more is that US households also maintain very high liquidity with cash and near-cash balances sitting at about US$4 trillion, or four times the pre-pandemic level. Idle cash sitting around is tempting to spend. Overall, these points all taken together suggest that the outlook for US consumer spending continues to be strongly supported by ‘excess’ savings.
Well, the Fed is still behind the game on inflation and the tide has turned on Tesla and even more so on electric vehicles. This and inflation are not unrelated. Russia did invade Ukraine and that war is ongoing with the US writing billions in aid checks. This is also inflationary.
PART A – Stock Markets
Highlights – USA
S&P500 declined 0.6% (up 26.9% y-t-d),
Dow fell 1.8% (up 16.3%).
Nasdaq100 added 0.7% (up 29.4%).
S&P 400 Midcaps lost 1.6% (up 17.8%),
Small cap Russell 2000 slumped 2.6% (up 15.8%).
Utilities dropped 2.5% (up 19.1%).
Banks slid 2.9% (up 37.2%),
Broker/Dealers fell 1.9% (up 48.9%).
Transports declined 1.0% (up 5.1%).
Semiconductors rose 1.7% (up 23.3%).
Biotechs dropped 2.7% (up 8.4%).
With bullion gaining $15, the HUI gold index added 0.5% (up 22.4%).
S&P 500 Stocks W/E 12/13/2024
Highlights – Europe Stocks
U.K.’s FTSE equities index was little changed (up 7.3% y-t-d).
France’s CAC40 slipped 0.2% (down 1.8%).
German DAX equities index was about unchanged (up 21.8%).
Spain’s IBEX 35 equities index dropped 2.6% (up 16.3%).
Italy’s FTSE MIB index increased 0.4% (up 14.9%).
Highlights – Asia Stocks
Japan’s Nikkei 225 Equities Index added 1.0% (up 17.9% y-t-d).
South Korea’s Kospi rallied 2.7% (down 6.1%).
India’s Sensex equities index added 0.5% (up 13.7%).
China’s Shanghai Exchange Index slipped 0.4% (up 14.0%).
Highlights – Australian Stocks
Australia’s ASX 200: Friday -0.4% to 8296, the lowest level in four weeks. (-1.5% on the week, the largest decline since early August.
Sharp losses in miners as Beijing’s pledge to boost its economy failed to lift investor sentiment. Iron ore prices traded in Singapore slumped 2.4% to below $US104.
BHP Group lost 1.5% to $41.17. Rio Tinto tumbled 2.8% to $120.72, also weighed by news it had committed $US2.5 billion to expand its lithium project in Argentina. Fortescue skidded 3.7% to $19.48, further undermined by a downgrade to hold by broker Morgans due to governance concerns.
Highlights – Emerging Markets Stocks
Brazil’s Bovespa index fell 1.1% (down 7.1%),
Mexico’s Bolsa index gained 0.5% (down 10.0%).
Turkey’s Borsa Istanbul National 100 index increased 0.4% (up 35.5%).
Biggest SPX Stock Winners and Losers November
For the month,
S&P500 returned 5.9%,
Nasdaq100 returned 5.3%
The small cap Russell 2000 returned 11.0%,
S&P400 Mid Cap’s 8.8%.
The Value Line Arithmetic returned 8.2%.
KBW Bank Index returned 13.6%, the Regional Banks 14.8%, the Securities Broker/Dealers 13.7%, and the Nasdaq Financial Index 14.2%.
Trump win and Republican sweep triggered quite a short squeeze.
The Goldman Sachs Most Short Index jumped 13.3% in November.
Tesla surged a third – inflating market capitalization to $1.1 TN – or 20 times Ford and 16 times GM.
Technical Analysis
Technical Analysis of key markets via KnovaWave
S&P 500
Daily: The SPX has traded like clockwork hitting the 78.6% extension right on cue into election.
Background: The move fueled by the violent ABC for the 5 waves up for SPX continue right into bottom of the median line to give us an (a) or C of a 4. with impulse after completing 5. Reversed hard with energy fueled from the power impulse down from near +1/8 ATH. On the way up (just like down) It accelerated after it broke the Tenkan through the rejected Kijun and then the Kijun to close back over the median and 8/8. Bulls this was a (ii) of a 5. Bears this is a a-b of a C off a completive V of degree. We watch if this low was a (iii), (a) or C. Will determine if sharp ABC completed off all time highs. We have to respect the number of alternatives of degree of 5. With such trends keep it simple support is Tenkan and Kijun and watch for ABC. No fear is the driving element.
Daily S&P 500 Flat Top Triangle
The break up was from above the 200dma. The balance from sharp reversal after the initial 3 wave down from the SPX wave 5 extension as Covid19 fed impulse accelerated under the Tenkan. From there we had seen the ABC or 1-2-3 spinning around the 61.8% of the move. Support began at the October 2019 lows. A manic wave 5 or 3 of some degree was a resolution for the ages. Note the 100% extension from the emotive element and MM levels when the spit kicks in. A manic wave 5 or 3 of some degree was a resolution for the ages. Note the 100% extension from the emotive element and MM levels when the spit kicks in
Weekly: The weekly confirms the daily sequence into the 78.6% extension.
Background: The reenergized SPX tripped in 3 to test recent break up at Tenkan from there we had had a powerful rally to ATH. Again notice what happened “Each new high has evolved after testing Tenkan key support which is the next line after Friday’s dump & minor bounce.” We watch for a spit of a spit Extensions are difficult to time, keep it simple.
S&P500 Weekly Outlook
Key for the impulse higher was the spit or retest of MM 8/8 and Tenkan San, which held with the previous highs and Tenkan. To repeat “We look for 3 waves down and reactions to keep it simple with the alternatives in the daily.” Keep an eye on the put/call ratio with recognition to the sheer size of contracts AND keep in mind the stimulus distortion. The spit per channel fractal and Adams rule launched back over the cloud where we were encased AND we back tested it. Watch if a spit or clear break support as Chikou rebalances
Dow Jones
NVIDIA (NVDA) and Sherwin-Williams (SHW) replaced Intel (INTC) and Dow Inc. (DOW) in the Dow Jones Industrial Average starting on Friday, November 8.
DJIA Weekly
NASDAQ 100
Nasdaq fell just short of retesting the ATH after it counced hard after the August rout.
Background: Fuel was after it broke and held the weekly Tenkan to see a spit of a spit fail which is completive of 5 of some degree with Chikou rebalancing. From there we sold off right to Tenkan (as did SPX) and bounced hard Support Tenkan to Kijun. Watch Chikou for divergence for continuation or failure. Divergence with Russell also a clue.
NASDAQ Tested Record Highs
Russell 2000
The small cap Russell RUT broke out of multi year flag. Unlike SPX and NDX we could not get to new ATH after it got through Tenkan and Kijun on the bounce. This is the index showing more of the fast money crowd and is trading like it. Needs to get traction in here for bulls. Support +1/8 through 7/8 (cloud base)
Russell Index Negative Divergence to NASDAQ
US Stocks Watch
Investors (and algos) will focus on the conference calls and outlooks. Last quarter everyone expected the worse, we saw critical updates on production in coronavirus impacted regions and if there is extended halting of operations weighing on multi-nationals.
Commonwealth Bank (ASX)
Commonwealth Bank scaled a new high, adding 1.4% to close at a record peak of $149.56 following the latest RBA decision and Trump 2.0. The other major banks rallied with Westpac up 2% to $32.14. ANZ advanced 1.3% despite reporting lower net profit in fiscal 2024. ANZ Chief executive Shayne Elliott said competition in the banking sector remained “intense”.
CBA Weekly Shape
NVidia $NVDA
“Nvidia Shares Are Up Roughly 28-Fold in the Past Five Years.”
Following the announcement of NVDA 4/1 split some levels off the energy break NVidia hadn’t looked back with many gaps below until it hit the 2.618 target of the exhaustion phase. We saw another power move off the $200 retest (old $800) & earnings off $300 which retested. It is a clear leader of SOX SMH look for cues there and ABC failures for changes.
Nvidia NVDA stock chart
Apple $AAPL
Apple gently motored up to new ATH over the massive $160 then $170 thru to $180 gamma level to new ATH. These levels will be key energy levels. Support from previous highs, resistance now Fibs and Murrey Math levels. Remember the impact $AAPL has, at least short term on all the major indices.
Apple AAPL Stock Chart
Well, This Didn’t Last Long:
Exxon’s Market Value Tops Tesla’s as Oil Rises, EV Sales Slow
Tesla’s market value peaked at nearly $1 trillion over Exxon in November 2021
Exxon Mobil Corp. surpassed Tesla Inc. in market value for the first time in more than a year
Tesla down 41% this year after sales miss analysts’ estimates
Path to electrification may be slower than previously thought. Major players like Ford Motor Co. and Hertz Global Holdings Inc. are reassessing their commitments to EVs as they grapple with slow market penetration.
Exxon has reversed a decade-long decline in oil production and is capitalizing on rising oil prices
Tesla’s shares had fallen to $147.05, a market capitalization of $469 billion.
Exxon’s shares has increased to $119.88, a market capitalization of $475 billion.
Tesla $TSLA
Exxon Mobil $XOM
Exxon Stock Chart
Part B: Bond Markets
Highlights – Treasuries
U.S. Treasuries all tenors recording five consecutive losses ahead of next week’s expected rate cut and despite a decent pair of note offerings.
5-yr note and longer tenors’ highest levels in three weeks.
The only strength was seen in Treasury bills, as their yields slipped to fresh lows for the year.
The daylong pressure on Treasuries weighed on equities, causing them to give up their starting gains, but the S&P 500 found some support near its unchanged level.
Overseas, there was disappointment surrounding a lack of a specific stimulus announcement in China while the U.K. reported weak growth figures for October, though the Bank of England is still expected to hold its bank rate steady when it meets next week.
This week’s underperformance in longer tenors, which could be reflective of concerns about hotter future inflation stemming from policy loosening, expanded the 2s10s spread by eleven basis points to 16 bps.
Crude oil recaptured its 50-day moving average (70.32), gaining $4.12, or 6.1%, for the week,
U.S. Dollar Index rose 0.1% to 107.02, advancing 1.0% for the week.
Total money market fund assets were unchanged at a record $6.771 TN.
Money funds were up $636 billion over 19 weeks (28% annualized) and $884 billion y-t-d (15.6% ann.).
Total Commercial Paper dipped $3.1 billion to $1.157 TN. CP was down $86 billion, or 7.0%, over the past year.
2-yr: +5 bps to 4.24% (+14 bps this week)
3-yr: +6 bps to 4.22% (+16 bps this week)
5-yr: +7 bps to 4.25% (+22 bps this week)
10-yr: +8 bps to 4.40% (+25 bps this week)
30-yr: +7 bps to 4.62% (+29 bps this week)
November:
2-yr: -5 bps to 4.16% (UNCH in November)
3-yr: -6 bps to 4.10% (-3 bps in November)
5-yr: -6 bps to 4.06% (-10 bps in November)
10-yr: -6 bps to 4.18% (-10 bps in November)
30-yr: -6 bps to 4.37% (-10 bps in November)
US Long Bond
Highlights – Federal Reserve
Federal Reserve Credit declined $4.3 billion last week to $6.856 TN.
Fed Credit was down $2.039 TN from the June 22, 2022, peak.
Over the past 274 weeks, Fed Credit expanded $3.129 TN, or 84%.
Fed Credit inflated $4.045 TN, or 144%, over the past 631 weeks.
Fed holdings for foreign owners of Treasury, Agency Debt dropped $20.8 billion last week to $3.296 TN – near the low back to 2017.
“Custody holdings” were down $6 billion y-o-y, or 2.%.
Highlights – Mortgage Market
Freddie Mac 30-year fixed mortgage rates bps this week to a six-week low 6.6% (down bps y-o-y).
Fifteen-year rates bps to 5.9% (down 3bps).
Bankrate’s survey of jumbo mortgage borrowing costs had 30-year fixed rates bps to a seven-week low 7.0% (down 4bps).
We do know we have massive speculation pockets, viz a viz the Semi stocks and cryptocurrency mania in just the matter of weeks. The Fed is effectively throwing additional fuel on historic speculative manias.Central banks have been adding liquidity to avoid systematic failure.
Highlights – European Bonds
Italian 10-year yields jumped 20 bps to 3.39% (down 31bps y-t-d).
Greek 10-year yields rose 17 bps to 3.07% (down 2bps).
Spain’s 10-year yields gained 17 bps to 2.93% (down 7bps).
German bund yields were 15 bps higher at 2.26% (up 23bps).
French yields rose 16 bps to 3.04% (up 48bps).
French to German 10-year bond spread widened one to 78 bps.
U.K. 10-year gilt yields jumped 14 bps to 4.41% (up 88bps).
Highlights – Asian Bonds
Japanese 10-year “JGB” yields dipped two bps to 1.04% (up 43bps y-t-d).
Part C: Commodities
Highlights
The Bloomberg Commodities Index rallied 1.2% (unchanged y-t-d).
Spot Gold added 0.6% to $2,648 (up 28.4%).
Silver declined 1.3% to $30.553 (up 28.4%).
WTI crude rallied $4.09, or 6.1%, to $71.29 (down 1%).
Gasoline rallied 5.0% (down 5%), and Natural Gas jumped 6.6% to $3.28 (up 31%).
Copper was little changed (up 8%).
Wheat gained 1.8% (down 12%), and Corn rose 2.6% (down 6%).
Bitcoin added $2,350, or 2.4%, to $101,790 (up 140%).
US Futures Performance W/E 12/13/24
November 2024
December 6 – Bloomberg (Sybilla Gross): “China’s central bank expanded its gold reserves in November, ending a six-month pause in purchases after prices for the precious metal rose to a record. Bullion held by the People’s Bank of China climbed by 160,000 fine troy ounces last month to 72.96 million fine troy ounces… The PBOC had added to its stockpiles for 18 consecutive months up until April this year, helping to underpin the strength in bullion prices.”
“Coffee hit a record high in New York on mounting worries over a global supply crunch that have made it one of the year’s hottest commodities. Major trader Volcafe Ltd. cut its outlook for production at world’s top supplier Brazil after a crop tour revealed the severity of an extended drought… Futures for the arabica variety have surged more than 80% this year amid crop setbacks in key growers… They rose as much as 5.5% on Tuesday, touching the highest in data going back to 1972…” December 10 – Bloomberg (Celia Bergin and Mumbi Gitau)
BDI Freight Index
Baltic Exchange’s main sea freight index, which monitors rates for ships carrying dry bulk commodities, Baltic Dry decreased 740 points or 35.34% since the beginning of 2024.
The capesize index, which typically transports 150,000-ton cargoes such as iron ore and coal, dropped 98 points to 2,626 points;
The panamax index, which usually carries 60,000-70,000 tons of coal or grain cargo, decreased 23 points to 1,083 points.
Among smaller vessels, the supramax index fell 3 points to 984 points. For the week, the benchmark index declined nearly 14%.
“Aluminum soared as China announced it was removing a tax rebate that covers over 5 million tons of exports of the metal. Futures in London jumped as much as 8.5% following the announcement from the country’s Ministry of Finance… China’s aluminum industry historically has exported significant amounts of the metal as semi-finished products…” November 15 – Bloomberg (Archie Hunter and Jack Ryan):
Copper
Copper is the bellwether industrial metal and moves on supply risks and hopes for global recovery in demand. Disruptions at major mines and Chinese plants which produce more than half of the world’s refined copper impact price.
Copper Futures Outlook
Gold
Central bank buying has also been a significant driver of its strength since 2022. Global central banks, led by China and India, continued adding to their gold reserves according to the World Gold Council.
December 6 – Bloomberg (Sybilla Gross): “China’s central bank expanded its gold reserves in November, ending a six-month pause in purchases after prices for the precious metal rose to a record. Bullion held by the People’s Bank of China climbed by 160,000 fine troy ounces last month to 72.96 million fine troy ounces… The PBOC had added to its stockpiles for 18 consecutive months up until April this year, helping to underpin the strength in bullion prices.”
November 17 – Bloomberg (Jake Lloyd-Smith): “Gold will rally to a record next year on central-bank buying and US interest rate cuts, according to Goldman Sachs…, which listed the metal among top commodity trades for 2025 and said prices could extend gains during Donald Trump’s presidency. ‘Go for gold,’ analysts including Daan Struyven said…, reiterating a target of $3,000 an ounce by December 2025. The structural driver of the forecast is higher demand from central banks, while a cyclical lift would come from flows to exchange-traded funds as the Federal Reserve cuts, they said.”
“Chinese buyers, spooked by a protracted property slump and a recent stock-market rout, are rushing toward gold as economic uncertainty looms… Gold consumption in China rose 5.94% from a year earlier to 308.91 tons in the first quarter, the state-backed China Gold Association said… Meanwhile, China’s imports of gold raw materials surged 78% in the same period, helping the country’s total gold output to jump 21.16%… In January-March, Chinese buyers’ purchase of gold bars and coins rose 26.77% to 106.32 tons, amounting to around a third of total consumption.” Wall Street Journal
China’s official reserve assets rose to the highest since November 2015. The country’s foreign exchange reserves rose to $3.2457 trillion by the end of March, the highest since December 2021, as the central bank aims to maintain stable holdings to fend off risks. They rose 0.6% from February and were up 1.9% from a year earlier.
Gold Weekly Outlook
Energy
US Crude Oil (WTI)
Daily: WTI Crude Oil has continued to rally since retesting the pennant breakout last December after completing the correction in 3 waves. From there it broke the pennant and retested to continue to retest the breakdown last October to break above those descending levels for higher. We are in a completive mode for bulls with this impulse, it’s a question of degree on the topside, use the Murrey math 240/60 grid. Completing a C or IV? Support is previous lows and the bull flag. The bear case is the high was a complete 5.
WTI Weekly KnovaWave Shape
Weekly: WTI crude oil futures held the support line from July 2021, having plunged around 50% off 2022 highs. It has broken to the topside of its sphere of influence to close out the quarter over Kijun and Tenkan which are now support. WTI completed 3 waves and powered through the tenkan and 50wma, h and held the retest. Risk support is the grid. Resistance weekly channel, Murrey Math levels and previous breaks (off monthly). Bear case is Wave 5 complete.
What we broke……. Crude Oil in the past quarter built a huge bull flag. We watch if the recent break was false, or we fail. Very clear pattern.
WTI Daily KnovaWave
The key is crowd behavior to help tell the story which in energy is often around geopolitics. A great example of why we watch ABC corrections and from here we get the energy from the break being balanced. This move that was powered by 50 dma Tenkan spit of a spit – hence the fractal energies reverberations.
Daily: US Natural Gas futures are a great example of rebalancing mania. The market is still correcting the manic 5 post the Ukraine invasion and beyond. Since the breakdown of the correction channel with failed breakups we have continued to multi year lows in a pennant formation after holding the daily 1/8. We now look at our Adam’s theory fractal rules with fractal spits powering these moves lower. Two clear alternatives, we are correcting the highs 5 or that was a 3 and we go higher. Resistance is heavy: 2/8 and cloud above. Kijun, 50 dma and cloud. Support is previous lows. Important to watch how this energy was built for shape correlation.
US Natural Gas KnovaWave Daily Grid
Like the larger wave on the way up it accelerated through previous highs (flat topped triangle energy) and over the resistance at 8/8 and new highs. We successfully tested that break in a pennant ABC. Previous highs (flat topped triangle energy) and 8/8 and new highs underscore the structure that fed the move and is key longer term in the collapse lower.
Weekly: Natural gas still correcting the past month when blew through all levels of support after breaking the weekly 50wma and the Kijun gave a kiss of death. From there we Broke down out of the corrective channel (Wave 4 or IV) to new multi-year lows. This week we closed right at the weekly Kijun and 1/8. around the 50wma and tenkan in the cloud. The instability stems from the sharp reversals that have failed indicative of speculative fervor like the previous impulsive spikes. Support is the 1/8 Sphere. Bulls need all the damage down to be rebuilt. Kijun is major resistance given energy higher came from a clean break of the Kijun.
John Maynard Keynes, 1920: “There is no subtler, no surer means of overturning the existing basis of society than to debauch the currency. The process engages all the hidden forces of economic law on the side of destruction and does it in a manner which not one man in a million is able to diagnose.”
“Trading of currency options swelled to a record after Donald Trump’s victory in the US presidential election, as traders rushed to bet on further dollar gains. Over $160 billion worth of contracts exchanged hands on Wednesday, the highest daily volume in data going back to 2013… Trading of euro options was four times higher than the recent average…, while the EBS platform saw an all-time record for the Chinese renminbi. Most of the activity on over-the-counter trades was driven by new positions betting on a stronger dollar…” November 8 – Bloomberg (Vassilis Karamanis)
The Yen Volatility Continues as Expected:
Yen weakness is providing key support to dollar melt-up dynamics with BOJ slow-motion “normalization” in a world of fast-moving dynamics. The dollar yen has traded 160.17 this cycle, the first time above 160 since April 1990.
Governor Kazuo Ueda on that move basically ceded the yen fragility issue to the Ministry of Finance (MOF), affirming Friday it wasn’t in the BOJ’s purview. He conveyed little concern for yen weakness, while downplaying its inflationary impact. The market accordingly took the yen out to the woodshed.
Highlights
December 11 – Reuters (David Lawder): “U.S. Treasury Secretary Janet Yellen said… the U.S. will ‘react strongly’ when countries try to manipulate their currencies for competitive advantage, but at the moment there is not such market intervention. Yellen said… she does not see any threat to the dollar’s reserve currency status, as no other currency can rival its global use in financial markets, trade and other transactions.”
December 11 – Financial Times (Harriet Clarfelt): “A surging US dollar and a ‘confluence of bad news’ have sparked the biggest sell-off in emerging market currencies since the early stages of the Federal Reserve’s aggressive rate-raising campaign two years ago. A JPMorgan index of EM currencies has fallen more than 5% over the past two-and-a-half months, putting it on course for its biggest quarterly decline since September 2022. The decline has been broad, with at least 23 currencies tracked by Bloomberg falling against the dollar this quarter.”
Post Trump 2.0 its worth remembering in the first quarter the dollar rode high against almost every major currency. We saw central banks, from Japan, China and India intervene, or consider intervening, to bolster their currencies. The yen in view of USDJPY 152 and the yuan struggling to break back below 7.2 USDCNH officials have stepped up efforts to stem any further depreciation.
In Japan it’s been verbal warnings and intervention, in China it has been state banks buying yuan and selling dollars. Remember these two are major competitors for export dollars. With that there’s a school of thought that Beijing could have grown more tolerant of a weak yuan to maintain its competitive edge against the yen.
Japan’s predicament is a major issue. Yet the sustainability of China’s currency peg might be the elephant in the market. The yen has devalued 11.3% versus the renminbi over the past year, with the Indonesian rupiah down 4.3%, the Thai baht 3.2%, and the Malaysian ringgit 2.2%.
“Japan said it stepped into the foreign exchange market twice last quarter, as speculation grows that more moves may be brewing given the recent bout of renewed yen weakness. The Ministry of Finance intervened on July 11 and 12, spending ¥3.17 trillion ($20.7bn) and ¥2.37 trillion respectively to prop up the yen…” November 7 – Bloomberg (Erica Yokoyama)
With China’s apartment Bubble deflation gaining further momentum, Beijing faces huge challenges to attain growth mandates. Maintaining competitiveness for China’s massive export sector will be a top priority. Especially with its archrival’s economy and stock market booming, Beijing is resorting to increasingly desperate measures to hold Bubble deflation at bay. According to Bloomberg, “China’s sovereign wealth fund likely bought at least $43 billion of onshore exchange-traded funds in the first quarter” – and this was only a portion of enormous “national team” market support.
Beijing used to claim they had studied and learned from Japan’s Bubble experience. Chinese officials later criticized U.S. and “western” central banks for adopting inflationary QE measures. Well, look who’s now talking central bank bond buying.
April 22 – Bloomberg: “China’s Ministry of Finance said it supports allowing the central bank to buy and sell government bonds, reaffirming a comment by President Xi Jinping that ignited market speculation about a change of monetary strategy. The ministry called for stepping up coordination between fiscal and monetary policy and ‘improving the mechanisms of base money injection and money supply adjustment,’ in an article written by a study group and published by the People’s Daily… It was based on a recent book that compiled Xi’s statements about finance and economics. In that text, Xi was quoted as saying that the People’s Bank of China should gradually increase the buying and selling of government bonds in open-market operations.”
As Beijing pushes ever harder to sustain its Bubble Economy and thwart systemic debt crisis, the world is watching. Ongoing massive Credit growth ensures an only greater debacle, while Beijing directives are bringing new meaning to “malinvestment.” Importantly, this is not the good old days when perceptions of a great and infallible Beijing meritocracy had global analysts – and rating agencies – reverent and inhibited. The bloom is off the rose, and skepticism is these days palpable.
April 24 – CNBC (Evelyn Cheng): “China’s state-directed economy may be creating the conditions for a new wave of bond defaults that could come as soon as next year, according to an S&P Global Ratings report… It would be the third round of corporate defaults in about a decade, the ratings agency pointed out. It comes against a backdrop of extremely few defaults in China amid concerns about overall growth in the world’s second-largest economy. ‘The real thing to watch for policymakers is whether the current directives are creating distorted incentives in the economy,’ Charles Chang, greater China country lead at S&P Global Ratings, said…”
For the week the U.S. Dollar Index gained 0.9% to 107.003 (up 5.6% y-t-d).
On the upside, the South African rand increased 0.9%, the Brazilian real 0.5%, the Mexican peso 0.3%, and the Norwegian krone 0.1%.
On the downside, the Japanese yen declined 2.4%, the Swiss franc 1.6%, the New Zealand dollar 1.2%, the British pound 1.0%, the South Korean won 0.8%, the euro 0.6%, the Canadian dollar 0.5%, the Australian dollar 0.5%, the Singapore dollar 0.5%, and the Swedish krona 0.4%. The Chinese (onshore) renminbi slipped 0.03% versus the dollar (down 2.39% y-t-d).
Australian Dollar – AUDUSD
The prior week the Australian dollar added 1.4 per cent in a tumultuous week when it plumbed a three-month low of US65.1¢ on news of a Donald Trump’s US election victory before rebounding to US66.51¢ on hopes of fresh China stimulus. The Aussie dollar is still correcting since completing a 5 at the pysch 80 level to fall under the weekly cloud in emotive fashion. The Australian dollar fell to test of the August lows of 0.7106 with Omicron fears. When that double bottom support broke it retested the Murrey Math Levels. Resistance the Cloud, Tenkan and Kijun like many commodities.
Australian Dollar KnovaWave Weekly Outlook
Japanese Yen – USDJPY
USDJPY broke above after weakness with Treasury yields to rush to +2/8 and channel convergence, we have come a long way from that 108.00 massive support for dollar-yen back through the top of the flat-topped triangle at 151/152. Any change will come from the weekly Kijun. Use your USDJPY Murrey 7/8 8/8 grid for now. EURJPY AUDJPY will determine risk on/off.
Japanese Yen v Dollar KnovaWave Weekly Outlook
“Japan’s Finance Minister Shunichi Suzuki said… that foreign exchange intervention should be done in a restrained manner, after data suggested Tokyo tapped a vast pool of foreign reserves for its recent yen-buying operations. ‘Foreign exchange intervention should be done with its necessity and effectiveness taken into account,’ Suzuki said… While intervention could be used to contain excessive moves in the currency market, such action ‘should be conducted in a restrained manner,’ Suzuki said.” June 6 – Reuters (Makiko Yamazaki, Tetsushi Kajimoto and Takaya Yamaguchi):
“The United States, Japan and South Korea agreed to ‘consult closely’ on foreign exchange markets in their first trilateral finance dialogue on Wednesday, acknowledging concerns from Tokyo and Seoul over their currencies’ recent sharp declines. The rare warning from the three countries’ finance chiefs came as receding expectations of a near-term U.S. interest rate cut pushed the yen to 34-year lows, keeping markets on alert on the chance of an intervention by Japan to prop up the currency.” April 17 – Reuters (Saqib Iqbal Ahmed)
Chinese Yuan – USDCNH
December 11 – Reuters: “China’s top leaders and policymakers are considering allowing the yuan to weaken in 2025 as they brace for higher U.S. trade tariffs as Donald Trump returns to the White House. The contemplated move reflects China’s recognition that it needs bigger economic stimulus to combat Trump’s threats of punitive trade measures, people with knowledge of the matter said. Trump has said he plans to impose a 10% universal import tariff, and a 60% tariff on Chinese imports into the United States. Reuters spoke to three people who have knowledge of the discussions about letting the yuan depreciate…”
November 26 – New York Times (Keith Bradsher): “Beijing has a powerful tool for responding to President-elect Donald J. Trump’s threatened new tariffs on Chinese goods: It could start a currency war, a step that poses formidable risks for China as well as the United States. Letting China’s currency, the renminbi, lose value against the dollar would be a tried-and-true answer to tariffs. A cheaper renminbi would make Chinese exports less expensive for overseas buyers, mitigating the harm to China’s competitiveness from Mr. Trump’s tariffs. Beijing did just that in 2018 and 2019, when Mr. Trump imposed tariffs in his first term.”
November 25 – Bloomberg (Chongjing Li): “A key level is starting to emerge for the yuan, as China tightens its grip on a currency that is facing fresh tariff threats from US President-elect Donald Trump. The People’s Bank of China has consistently set its daily reference rate — Beijing’s preferred tool to guide yuan expectations — stronger than 7.2 per dollar since the US election, despite wild swings in the greenback and increasing predictions by analysts that the central bank would buckle.”
November 13 – Bloomberg: “China moved to support the under-pressure yuan for a second day, through its daily reference rate for the managed currency. The People’s Bank of China set the so-called yuan fixing at 7.1966 per dollar, about 359 pips stronger than the average estimate… On Wednesday, the gap between the fixing and estimate was 445 pips, the widest since early August. The yuan has come under pressure alongside global peers as Donald Trump’s US election victory bolstered the dollar to its highest in two years.”
June 3 – Reuters (Alun John): “More global reserve managers plan to increase exposure to the now high-yielding U.S. dollar as their interest in China’s yuan has soured due to low returns and geopolitical tensions, the Official Monetary and Financial Institutions Forum said. The data, from a survey carried out by the think tank…, challenges – at least in the short term – the trend towards de-dollarisation, the idea that countries will diversify away from dollars.”
“Chinese businesses are hoarding dollars because they expect their own currency to weaken, and that in turn is exacerbating a slide in the yuan… This feedback loop has been playing out for months in mainland currency markets, spurred on by the dollar’s rising yield. Foreign exchange deposits have climbed $53.7 billion since September to $832.6 billion… Analysts say one of two things needs to happen to end the downward spiral: the Federal Reserve needs to make deep rate cuts or the yuan needs to hit some form of a trough. Both seem distant.” April 17 – Reuters
China manages its currency onshore by setting a daily reference rate against the dollar at 9:15 a.m. local time, around which it is then permitted to trade in a 2% range. The PBOC has kept the daily rate in such a tight range this year that a gauge of volatility in the fixing has dropped to the lowest since before the shock yuan devaluation of 2015.
Canadian Dollar – USDCAD
The Loonie is holding the Tenkan after a 3 year high in June and corrected that in 3 waves led by the AUD and NZD with oil price impacting direction. Watch flat Kijun and Tenkan at 8/8. Use Fibs for support and resistance.
Canadian Dollar KnovaWave Weekly Outlook
Mexico Peso – USDMXN
Mexico’s currency is part of a carry trade that involves investors borrowing in currencies that have low interest rates, such as the Japanese yen or Swiss franc, and buying higher yielding ones such as the Mexican peso or, recently, the U.S. dollar. It has boomed in popularity as interest rates have diverged around the world and market volatility has stayed low. after the Mexican election this year the peso had a dramatic fall against the yen – it dropped 4.4% on that Monday in its biggest daily decline since the COVID-19 crisis.
The peso had climbed to the strongest in almost nine years driven by relatively high local interest rates and low currency volatility until, that sell off.
December 9 – Bloomberg (Alex Vasquez and Maria Eloisa Capurro): “Mexico’s headline inflation slowed slightly more than expected in November, boosting the odds of a fourth straight interest rate cut at the central bank’s meeting next week. Official data… showed consumer prices rose 4.55% from a year prior, under both the 4.6% median estimate…”
USDMXN KnovaWave Weekly Outlook
December 11 – Financial Times (Harriet Clarfelt): “A surging US dollar and a ‘confluence of bad news’ have sparked the biggest sell-off in emerging market currencies since the early stages of the Federal Reserve’s aggressive rate-raising campaign two years ago. A JPMorgan index of EM currencies has fallen more than 5% over the past two-and-a-half months, putting it on course for its biggest quarterly decline since September 2022. The decline has been broad, with at least 23 currencies tracked by Bloomberg falling against the dollar this quarter.”
Euro – EURUSD
Euro continues to bump up against that downtrend line from 2020 and spinning around the 50% of that year’s panic sell. The euro trades in what seems like eternal flags in the channel. We watch if Kijun (pink) testing Tenkan (orange) creates any impulse as EURUSD consolidates at the cloud. Watch 3 waves to see development for continuation. Watch for impulse off Chikou rebalance. Again governed by EURGBP and Bund volatility.
Euro KnovaWave Weekly Outlook
British Pound – USDGBP
British pound classic retest of daily cloud break with magnet pulls of cloud twist after ABC correction – will need Tenkan to break through Kijun for more strength. The upcoming month will be heavy on UK data and election speculation which could mean an eventful time for the British pound.
British Pound KnovaWave Weekly Outlook
Bitcoin
Bitcoin traded this week to a new ATH $99,978, ending the week with 2024 gains of 132%. Since the election, Bitcoin has surged 43%, with Ethereum up 39%, Ripple 215%, Cardano 240%, Solana 54%, and Dogecoin 144%. Bloomberg’s monitor page has expanded to include pricing for 58 crypto currencies.
Bitcoin soared 10% to a record $75,959 (ended the week up 80% y-t-d) after the Trump election 2.0. Bitcoin is performing technically to perfection. Impulse begets impulse. To understand panic, understand greed. Bitcoin exploded higher following its correction impulsively upon completing 5 waves up at +2/8. Each Tenkan and Kijun tap saw an explosive kiss of death until we completed 3 waves to around 28,000. From there we have seen extreme volatility to a new record high and retest.
Bitcoin KnovaWave Weekly Outlook
We have seen what you would expect from a 5-wave impulse peak and ABC correction, a violent correction and completion. Use Murrey Math levels for corrections and targets as algorithms control the herd here, support is the cloud and sharp ABC, 1-2 moves. From there prices agitated towards those ATHs as news of a Bitcoin ETF fueled the rally, sound familiar? But this time it wasn’t signaling we are in a 3 high probability but a 5.
On the Risk Radar
Geopolitical Tinderbox Radar
The Week Ahead – Have a Trading Plan
WatchEarnings, Central Bankers and Geopolitics speeches, reportsandrate moves.
Next Week’s Risk Dashboard
A week packed with central banks, fiscal updates, key data
FOMC to cut, ignore the SEP
US core PCE likely to validate the Fed’s cut
Canada’s deficit under tariff scenarios
Canadian CPI could soften
BoC’s Macklem kicks off mandate review
BoJ likely to hold off on a hike
Japanese inflation to follow Tokyo’s hot print
UK jobs, wages, CPI arrive before the BoE
BoE: pause, while data may validate the dissenter
Banxico: 25 or 50?
BanRep teed up for another 50bps
BCCh: cut with a careful bias
Riksbank said it will cut, so it will cut!
Norges Bank to stay on hold
BoT unlikely to surprise again
BI nervously watching the rupiah
CBCT to extend pause
BSP to cut a third time
Central Bank of Russia to deliver mega-hike
No change to China’s lending rates, and it wouldn’t matter anyway
NZ fiscal update
PMIs: EZ, UK, US, India
Retail sales: US, Canada, UK
US Economic Highlights
Monday: December Empire State Manufacturing Survey (prior 31.2) at 8:30 ET; flash December S&P Global U.S. Manufacturing PMI (prior 49.7) and flash December S&P Global U.S. Services PMI (prior 56.1) at 9:45 ET
Tuesday: November Retail Sales (prior 0.4%) and Retail Sales ex-auto (prior 0.1%) at 8:30 ET; November Industrial Production (prior -0.3%) and Capacity Utilization (prior 77.1%) at 9:15 ET; October Business Inventories (prior 0.1%) and December NAHB Housing Market Index (prior 46) at 10:00 ET; and $13 bln 20-yr Treasury bond reopening results at 13:00 ET
Wednesday: Weekly MBA Mortgage Index (prior 5.4%) at 7:00 ET; November Housing Starts (prior 1.311 mln), Building Permits (prior 1.416 mln), and Q3 Current Account Balance (prior -$266.8 bln) at 8:30 ET; weekly crude oil inventories (prior -1.43 mln) at 10:30 ET; and December FOMC Decision (prior 4.50-4.75%) at 14:00 ET
Thursday: Q3 GDP — third estimate (prior 2.8%), Q3 GDP Deflator — third estimate (prior 1.9%), weekly Initial Claims (prior 242,000), and Continuing Claims (prior 1.886 mln) at 8:30 ET; November Existing Home Sales (prior 3.96 mln) and November Leading Indicators (prior -0.4%) at 10:00 ET; weekly natural gas inventories (prior -190 bcf) at 10:30 ET; and October Net Long-Term TIC Flows (prior $216.1 bln) at 16:00 ET
Friday: November Personal Income (prior 0.6%), Personal Spending (prior 0.4%), PCE Prices (prior 0.2%), and Core PCE Prices (prior 0.3%) at 8:30 ET; and final December University of Michigan Consumer Sentiment (prior 74.0) at 10:00 ET
Bond market Highlights
Monday:
Tuesday: $13 bln 20-yr Treasury bond reopening results at 13:00 ET
Wednesday:
Thursday:
Central Bank Highlights
We get the latest monetary policy decisions by over a dozen global central banks this week plus a potentially important BoC speech. Apparently, they have their collective sights set on quieter times through the holiday season and year-end. Expectations are laid out below.
BCCh—A Careful Cut
Chile’s central bank is expected to cut its overnight rate by 25bps on Tuesday. Consensus is nearly unanimous.
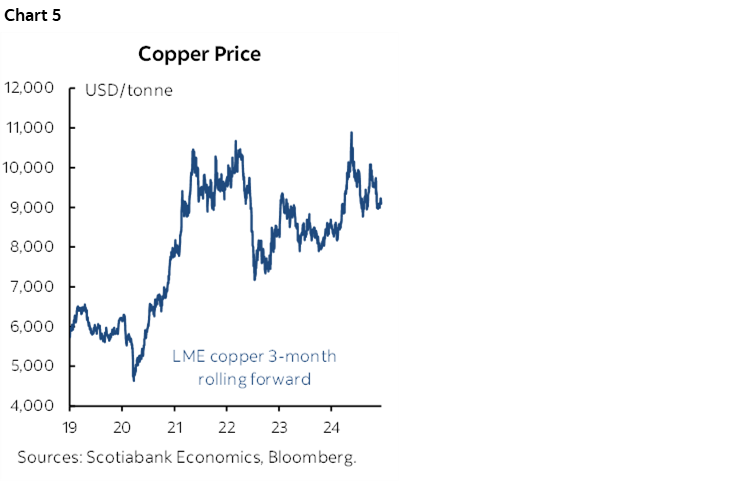
The central bank conveyed a bias toward future easing at its last decision on October 17th when they cut by 25bps. Since then, there has been a lot of new information. The Chilean peso has depreciated with CLP down about 4% to the dollar and faces an uncertain outlook related to commodities and world growth. CPI inflation has continued to trend lower at 4.2% y/y in November, though wage growth is running at over 8% y/y. The economy grew a touch stronger than expected in Q3 (0.7% q/q SA nonannualized). Copper prices have moved somewhat lower since the middle of this year, but still remain fairly elevated against an uncertain outlook related to the strength of the Chinese economy and trade tensions (chart 5).
FOMC—S.E.P. Will Be D.O.A.
The two-day FOMC meeting starting on Tuesday will culminate in the delivery of the policy statement and revised Summary of Economic Projections including the dot plot at 2pmET on Wednesday. Then Powell takes to the podium thirty minutes later.
A 25bps cut is expected. It’s also basically fully priced. No changes to balance sheet management plans are expected as quantitative tightening is expected to remain on autopilot for now.
While more likely at the January FOMC or even later, there is the risk of at least further discussion around potentially tweaking relative rates of interest to funding markets. Recall that in the minutes to the prior meeting on November 6th–7th there was the following reference:
“Some participants remarked that, at a future meeting, there would be value in the Committee considering a technical adjustment to the rate offered at the ON RRP facility to set the rate equal to the bottom of the target range for the federal funds rate, thereby bringing the rate back into an alignment that had existed when the facility was established as a monetary policy tool.”
This discussion would have been led by FOMC members with a closer interest in funding markets, such as Dallas Fed President Logan (formerly the markets head at the NY Fed), Governor Waller, and NY’s Williams. The reference to “future meeting” as opposed to, say, ‘soon’ may indicate some patience.
But the bigger issue may be how the Committee alters the Summary of Economic Projections this time compared to the last full forecast update in September. A lot has changed since then. Don’t expect it all to be fully reflected in the refreshed forecasts. In fact, I wouldn’t pay that much serious attention to anyone’s forecast rounds just yet.
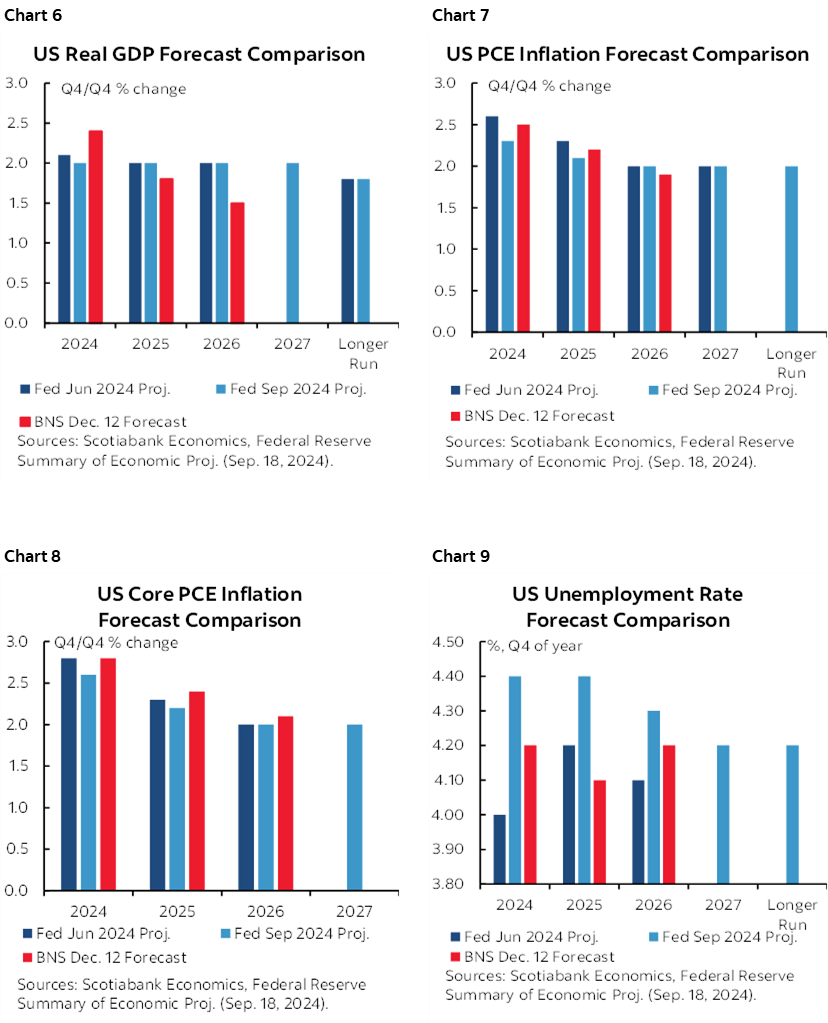
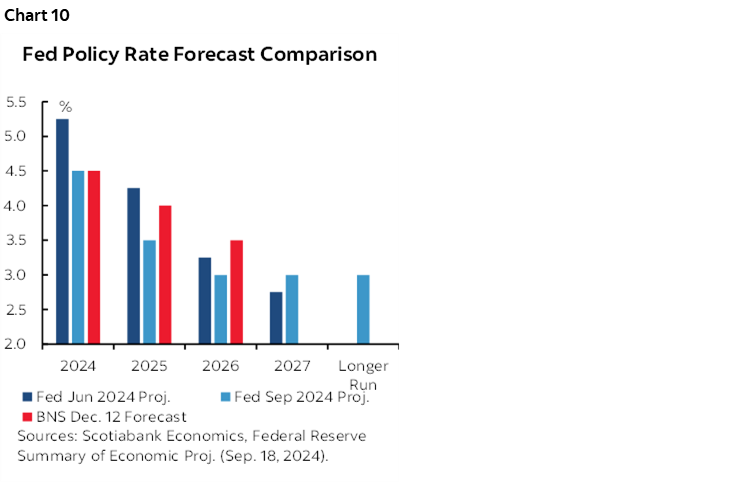
The FOMC’s last projections are compared to our current forecasts in charts 6–10. At a minimum, the Committee is likely to acknowledge data to date and revised up estimates for this year’s GDP growth. We expect weaker US growth next year and in 2026. The Committee has to revise up inflation estimates for this year, and we are slightly higher in 2026 than their prior projection. The same pattern applies in terms of core PCE. Finally, on the unemployment rate, the Committee is getting positively surprised this year and we think that may persist next year.
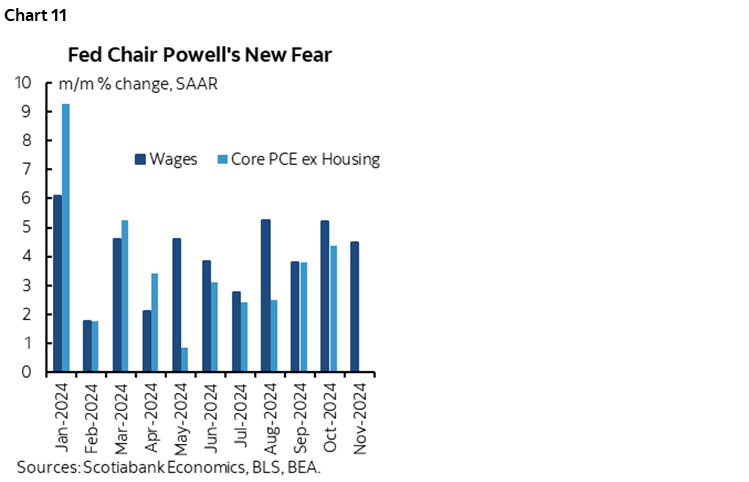
It’s likely that the FOMC reduces the amount of projected easing next year, but not by much while remaining on a path toward a neutral rate of around 3% in the outer years. Instead of a fed funds upper limit of 3.5% being conveyed for the end of 2025 (implying 100bps of cuts after this one), look for maybe 25bps to at most 50bps of fewer cuts (hence 50–75bps of cuts in 2025). Recent strength in the US economy including prices and wage figures (chart 11) lends toward a higher for longer bias. Our own projection estimates that the fed funds upper limit will end 2025 at 4%, implying 50bps of cuts in 2025 after this week’s.
The rub lies in the fact that—like many other forecasters—the FOMC and particularly Chair Powell don’t know what assumptions to make about policy shifts in 2025 by the Trump administration and are probably going to be unwilling to incorporate many of them now. If they do know, or think they know, then the fall back among central bankers is to only incorporate such expectations when they become fact or at least highly probable. Upgrading projections only on known information to date including data and wealth effects from financial market conditions should be treated carefully. It’s very unlikely that Committee members will incorporate any assumptions on tariffs, regulatory change, immigration policy shifts, and net fiscal policy shifts on the tax and spending sides combined. If they do, it will be a partial exercise maybe incorporating lower taxes for longer.
Because of this massive uncertainty surrounding the incoming administration’s policies, what effect they may have on markets and data, when such effects may arise, and how other countries may respond, the SEP and the dot plot shouldn’t be treated with much seriousness at this point. The bigger focus will be upon how the FOMC shifts at the next decision on January 29th—nine days after inauguration day—and in the next SEP and dot plot in March.
Bank of Thailand—No More Surprises?
Thailand’s central bank is widely expected to hold its benchmark rate unchanged at 2.25% on Wednesday. It cut by 25bps in October in a surprise move. Following that move, Assistant Governor Panyanukul remarked that it was not the start of an easing cycle and was “just recalibrating the policy interest rate.” Like many other central banks, the US election and risks it poses to conditions across Asia may merit a wait and see approach.
Bank Indonesia—Rupiah Stability Remains the Focus
Consensus is somewhat divided toward Bank Indonesia’s next move on Wednesday. A little over half of forecasters expect a 25bps cut while the rest expect a hold at 6%. BI has held since a surprise 25bps cut back in September. Since then, however, the rupiah has depreciated by about 4% to the dollar and has recently continued along a mildly depreciating path. The central bank treats currency and broader market stability seriously including because of the implications for inflation given high import propensities. Uncertainty toward when the incoming US administration’s policies may be will likely retain a cautious bias at this meeting.
BoE—See You in 2025
The Bank of England delivers a policy decision on Thursday. Markets and consensus unanimously expect a hold with Bank Rate staying at 4.75%. A hold would extend the “gradual” guidance that has been marked by the first cut in August, then a skip in September, then another cut in November.
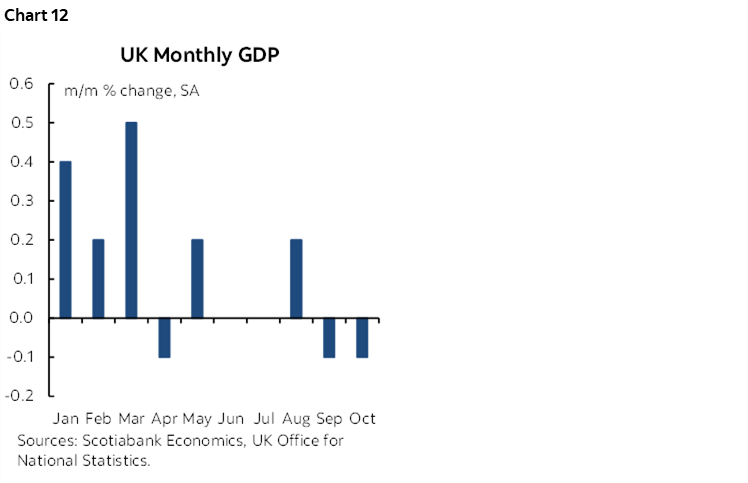
DepGov Swati Dhingra is expected to dissent in favour of another cut at this meeting. Depending on what happens in the CPI figures the day before, Dhingra’s view might get a boost especially in light of the pattern of broadening weakness in the UK economy that has only posted growth once in the past five months (chart 12).
Forward guidance is also unlikely to surprise. In a recent FT interview (here), Governor Andrew Bailey said “We always condition what we publish in terms of the projection on market rates, and so as you rightly say, that was effectively the view the market had.” When the interviewer asked if that meant the central forecast for 2025 was four cuts, he said “Yup. We’ve been looking at a number of potential paths ahead—and some of them are better than others.” Going in “gradual” fashion is Bailey’s mantra.
Bank of Japan—Maybe Waiting Would be Wise
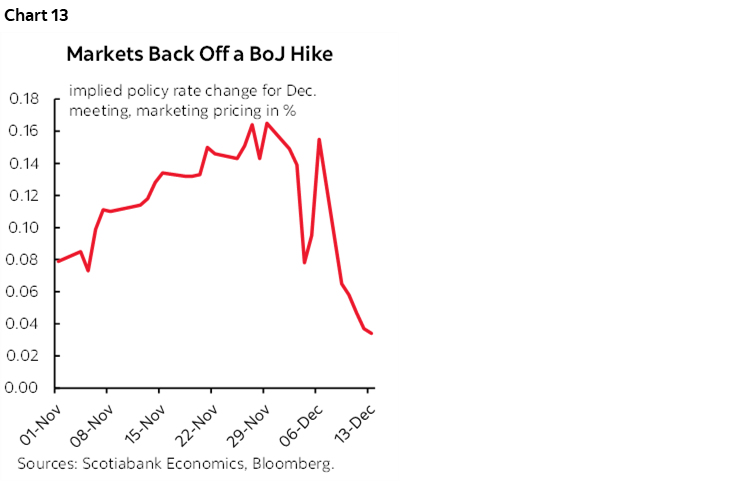
The Bank of Japan delivers a fresh policy decision on Thursday. Markets have dramatically backed off pricing a decent shot at a hike this time (chart 13). About three-quarters of consensus expects a hold, but a notable one-quarter still expects a 25bps hike. The BoJ is not averse to delivering surprises.
The volatility in market pricing for this meeting has followed the somewhat erratic BoJ communications. After the last decision that held the policy rate unchanged on October 31st, Governor Ueda indicated that the December meeting was ‘live’, code language for a possible hike. More recently, newswires have reported anonymous officials familiar with the BoJ’s thinking to be favouring a hold as it evaluates US policy risks, how the Japanese government’s stimulus plans may take shape, further risks to the yen after it has significantly depreciated since mid-September, more data, and further developments toward the Spring round of wage negotiations.
And yet the heated gains in core CPI combined with expectations for a third straight season of hot gains coming out of the Spring “Shunto” wage negotiations could give rising confidence in favour of tightening if not at this meeting, then the next one on January 24th that is significantly priced for a hike. Four days after US inauguration day.
Central Bank of China Taiwan—Still Holding
CBCT is unanimously expected to leave its benchmark rate unchanged at 2% on Thursday. At 2.1% y/y, inflation remains comfortably near the 2% inflation target.
BSP—A Third Cut
The central bank of the Philippines is unanimously expected to cut by another 25bps on Thursday. It began easing with a 25bps cut in August followed by another in October. Typhoons have contributed to growth undershooting the 6–7% GDP target.
Riksbank—Central Bank Aligned with Markets, or Vice Versa?
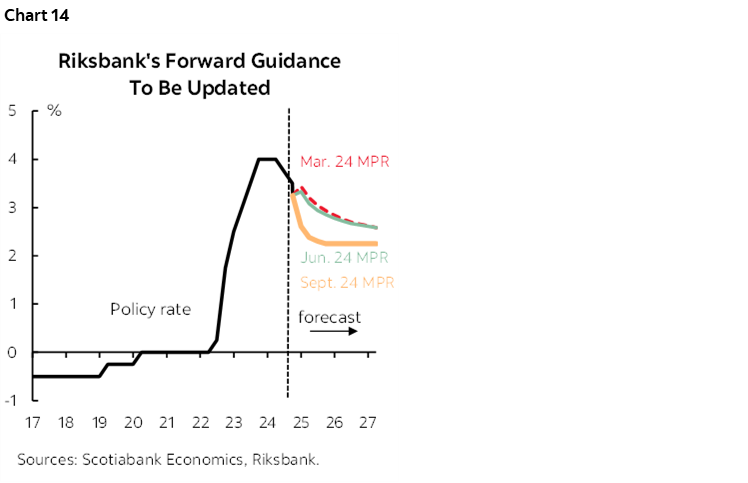
Sweden’s central bank is widely expected to cut its policy rate by 25bps to 2.5% on Thursday. There will also be refreshed projections including explicit forward guidance for the policy rate.
The last statement in November that delivered a cut said “the policy rate may also be cut in December.” Love it. Clarity from a central bank, imagine that. The prior rate projections in September pointed toward achievement of about a 2% policy rate by fairly early in 2025 which is about where markets are now priced (chart 14).
Norges Bank—Not Yet!
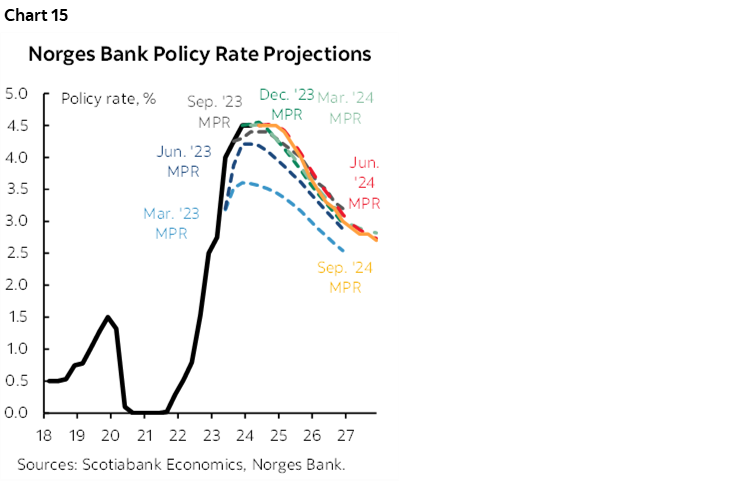
Norway’s central bank is widely expected to hold its deposit rate unchanged at 4.5% on Thursday. That would extend the policy rate hold for a full year since the last move which was a 25bps hike one year ago. Consensus and markets are unanimous toward the decision, and markets are also priced for no change in January either. Refreshed forward guidance will be offered at this meeting (chart 15).
Speaking of central bank clarity, this one told us at the last decision that “The policy rate will most likely be kept at 4.5 percent to the end of 2024.” They had the results of the US election since the decision was on November 7th. Norges has also observed a greater than expected increase in inflation with underlying CPI rising to 3% y/y in November.
PBOC—It’s Not Working So Far
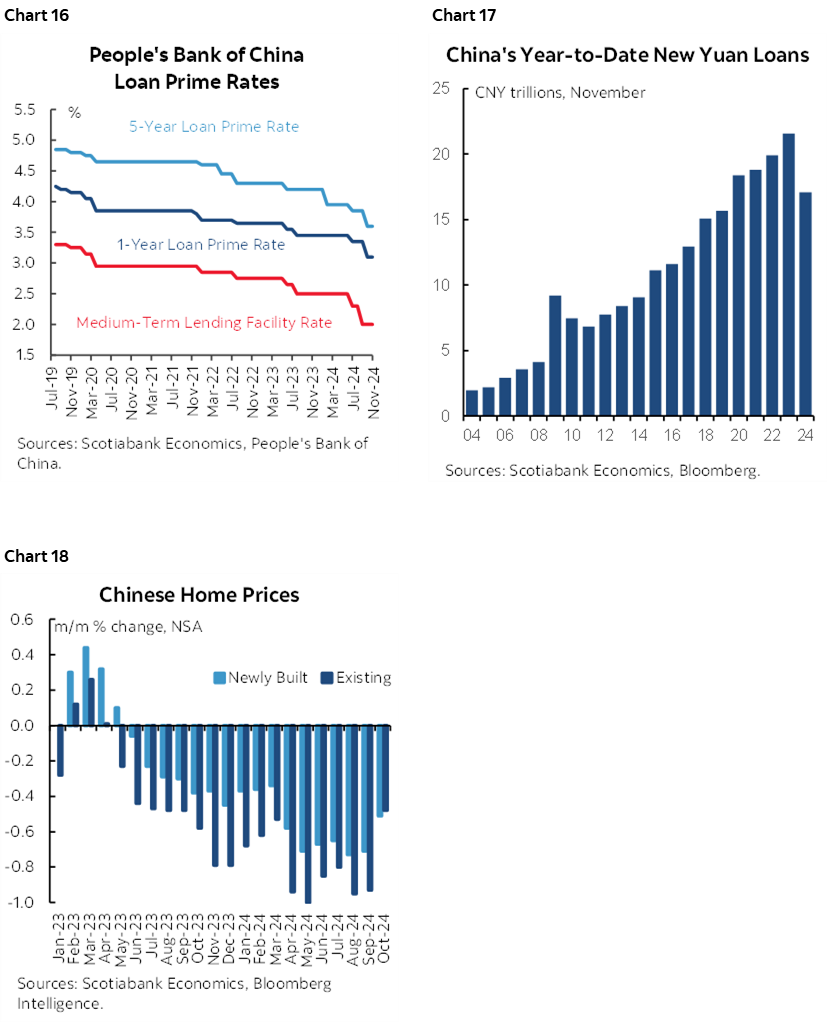
China is not expected to alter banks’ loan prime rates on Thursday. They are expected to remain at 3.1% for the 1-year and 3.6% for the 5-year that is important to the property market. More easing has been guided by policymakers going into 2025 on both the monetary and fiscal policy fronts, but the outcome of this past week’s meetings was somewhat disappointing.
Credit demand has not responded well so far to a series of rate cuts that have lowered the 5-year rate by 105bps since October 2021 (chart 16). We can see this in the year-to-date growth in yuan-denominated loans (chart 17). Would you borrow if you felt house prices were still likely to remain in freefall (chart 18)? Would you go out on a limb when faced with potentially massive trade tensions? The sensitivity of money demand to falling rates is impaired to say the least.
Banxico—How Judgemental Will it Be?
Our economists in Mexico City expect the central bank to cut by another 25bps on Thursday. That would take the overnight rate down to 10%. A significant minority within consensus thinks the central bank might cut by 50bps.
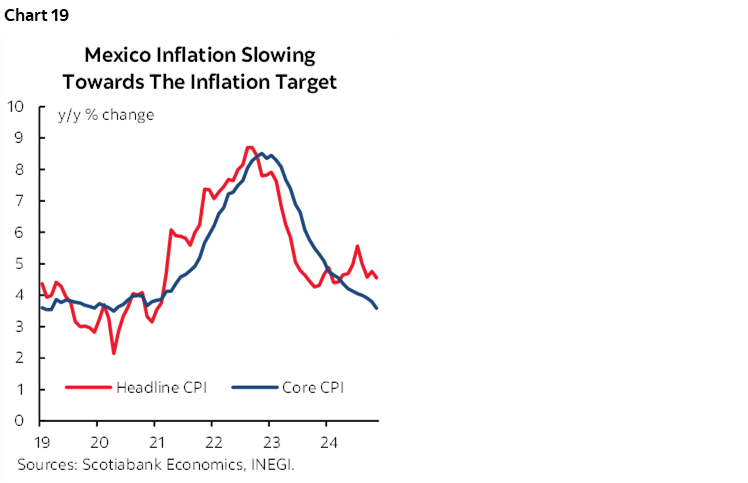
Inflation has continued to decline, hitting 4.6% y/y in October. Core inflation has also fallen to 3.6% y/y, extending the nearly two-year streak of decelerating readings (chart 19). A continued easing bias was conveyed in the last decision on November 14th—after the US election—when the statement said “Looking ahead, the Board expects that the inflationary environment will allow further reference rate adjustments.”
A 50bps cut may be delivered if Banxico wishes to pre-judge US tensions including prospects for a disinflationary surge in Mexico’s labour supply as migrants return but may be avoided until greater clarity emerges on prospects of US tariffs and how Mexico may retaliate.
BanRep—Follow the Trend
Colombia’s central bank is almost unanimously expected to cut its policy rate by 50bps on Friday. Our Bogota-based economist Jackeline Piraján Diaz is among the forecasters who are leaning that way.
BanRep has cut by 50bps at each of the past six decisions and so the trend is your friend here. Still, at 9.75%, the policy rate remains elevated as inflation has continued to decline and growth has recently disappointed with Q3 GDP up by just 0.2% q/q SA, or half of consensus.
Central Bank of Russia—Paying the Price
Russia’s central bank closes out the week with another large rate hike expected. Estimates of how large range from 100–300bps. Inflation has risen to nearly 9% y/y. The tumbling ruble points to further import price pressures as it has been on a steadily depreciating path of 23% to the dollar since August.
Commentary via Scotiabank
US Earnings Highlights
The earnings season is mixed as the earnings beat ratio remains high, but the revenue beat ratio is a coin-toss and other earnings details by sector and company have been highly variable.
Monday (Dec 9)Pre-Market: After-Hours:
Tuesday (Dec 10)PremarketPostmarket
Wednesday (Dec 11)PremarketPostmarket,
Thursday (Dec 11)Premarket Postmarket
Friday (Dec 13)Premarket
US IPO Week Ahead
With the Christmas holiday on the horizon, there are no IPOs currently scheduled to price in the week ahead.
Some small issuers may complete last-minute listings. Some names may include Singapore event management firm Fast Track Group (FTRK) and Hong Kong freight forwarding company New Century Logistics (NCEW).
Focus on yourself and what YOU CAN INFLUENCE, set your trading plan and goals in be set for 2024.
We use cookies on our website to give you the most relevant experience by remembering your preferences and repeat visits. By clicking “Accept All”, you consent to the use of ALL the cookies. However, you may visit "Cookie Settings" to provide a controlled consent.
This website uses cookies to improve your experience while you navigate through the website. Out of these, the cookies that are categorized as necessary are stored on your browser as they are essential for the working of basic functionalities of the website. We also use third-party cookies that help us analyze and understand how you use this website. These cookies will be stored in your browser only with your consent. You also have the option to opt-out of these cookies. But opting out of some of these cookies may affect your browsing experience.
Necessary cookies are absolutely essential for the website to function properly. These cookies ensure basic functionalities and security features of the website, anonymously.
Cookie
Duration
Description
cookielawinfo-checkbox-analytics
11 months
This cookie is set by GDPR Cookie Consent plugin. The cookie is used to store the user consent for the cookies in the category "Analytics".
cookielawinfo-checkbox-functional
11 months
The cookie is set by GDPR cookie consent to record the user consent for the cookies in the category "Functional".
cookielawinfo-checkbox-necessary
11 months
This cookie is set by GDPR Cookie Consent plugin. The cookies is used to store the user consent for the cookies in the category "Necessary".
cookielawinfo-checkbox-others
11 months
This cookie is set by GDPR Cookie Consent plugin. The cookie is used to store the user consent for the cookies in the category "Other.
cookielawinfo-checkbox-performance
11 months
This cookie is set by GDPR Cookie Consent plugin. The cookie is used to store the user consent for the cookies in the category "Performance".
viewed_cookie_policy
11 months
The cookie is set by the GDPR Cookie Consent plugin and is used to store whether or not user has consented to the use of cookies. It does not store any personal data.
Functional cookies help to perform certain functionalities like sharing the content of the website on social media platforms, collect feedbacks, and other third-party features.
Performance cookies are used to understand and analyze the key performance indexes of the website which helps in delivering a better user experience for the visitors.
Analytical cookies are used to understand how visitors interact with the website. These cookies help provide information on metrics the number of visitors, bounce rate, traffic source, etc.
Advertisement cookies are used to provide visitors with relevant ads and marketing campaigns. These cookies track visitors across websites and collect information to provide customized ads.