Geopolitics, domestic politics, financial markets and conspiracy theory continue to develop bizarrely, is it a reach to say we are living in a Bizarro world? A highlight was two of the most powerful people in the world, U.S. President Trump and Federal Reserve chair wearing construction hard hats bickering in front of the cameras about the cost of the Fed’s refurbishment project. For markets we saw new all time highs and tradional experts get run over. This week the blame was again on retail investors and Meme stocks. Notably the Goldman Sachs Short Index rallied 71% from April 9th intraday lows to Thursday’s intraday highs.
“Peter Atwater, an adjunct professor at the College of William & Mary who studies retail investors, said the current wave of activity reflects a shift in both market sentiment and investment toolkit. Meme stocks trading, he says, has lost its sense of novelty — and that’s precisely the point. ‘We’ve normalized memeing,’ he said. ‘There’s a yawn to it now.’ In Atwater’s view, the most aggressive traders have already moved on to riskier frontiers – digital tokens, leveraged ETFs, prediction markets — while meme stocks have become more of a cultural rerun’… Contracts that expire within 24 hours made up a record 62% of the S&P 500’s total options so far this quarter…, with more than half of the activity being driven by retail trading.” – Bloomberg
What is clear the economic and market analysts have got it all wrong so far, tends to happen when all follow each other and are doused with political bias. Again we saw the affects of loose financial conditions fueling upside surprises in economic activity and inflation. Meanwhile the markets have blinkers on as they loose financial conditions fuel the moves. The economy is performing much better than projected by the experts and inflation much tamer than also projected by those experts.
The preliminary July Services PMI Index jumped to a stronger-than-expected 55.2, the highest reading since last December. The Services Employment subcomponent posted its fifth straight gain to the strongest reading (52.6) since January. Prices were also higher.
More indications this week of reemerging labor market tightening. Initial Jobless Claims declined for the sixth straight week. At 217,000, claims are within a thousand of the lowest level back to early-February.
The Credit system is firing on all cylinders with the exception of mortgage debt. About $61 billion of US leveraged loans hit the market Monday, the second-most ever, as junk-rated borrowers continue rushing to lower borrowing costs by repricing existing loans. There were 33 launches with all but six of them repricings. The largest was a $7.57 billion offering for medical supplies giant Medline, the bulk of which will be used to reprice a term loan.” – Bloomberg
Traders and investors have become increasingly fearless and in such a mood reshape the narrative to fit with a bullish or bearish mantra. In this vein stocks have moved on from tariff panic, faced with political fatigue have largely taken President Trump, gaffes and all in it’s stride.
The Week Gone By:
S&P500 gained 1.5% (up 8.6% y-t-d),
Dow added 1.3% (up 5.5%)
Nasdaq100 gained 0.9% (up 10.8%).
S&P 400 Midcaps rose 1.5% (up 3.1%),
Small cap Russell 2000 increased 0.9% (up 1.4%).
Semiconductors fell 1.5% (up 13.4%).
Biotechs rallied 2.6% (up 0.3%).
While bullion fell $13, the HUI gold index rallied 5.1% (up 60.6%).
Gold futures settled $37.90 lower (-1.1%) at $3,335.60/oz Friday, finishing down (-0.7%) on the week
Crude oil finished in the red Friday, down $0.86, or 1.3%, for the week,
U.S. Dollar Index rose 0.3% to 97.69 Friday, narrowing this week’s loss to 0.8%.
Treasury Yields:
2-yr: UNCH at 3.92% (+4 bps this week)
3-yr: -1 bp to 3.86% (+2 bps this week)
5-yr: -2 bps to 3.95% (-1 bp this week)
10-yr: -2 bps to 4.39% (-4 bps this week)
30-yr: -2 bps to 4.93% (-7 bps this week)
Mega cap stocks had an outsized impact on the broader equity market. Apparent anomalies in how markets are responding to rash and sudden developments may have sound explanations and could stabilize, versus extrapolating these developments with extreme and premature views such as how they finally represent the end of longstanding dollar dominance and US exceptionalism.
Week Ahead Catalysts:
Geopolitical: Chaos Ramps Up
Market volatility is likely to persist into the coming weeks as markets grapple with whether temporary or more profound forces of change are upon financial markets due to unintended effects of Trump’s trade wars.
Trump’s tariff deadlines intensify this week. Multiple central banks weigh in with decisions including the Federal Reserve, BoC, BoJ, Brazil, BCCh, BanRep and SARB. Data risk will be high including US nonfarm payrolls, the Fed’s preferred inflation gauges, Eurozone inflation, GDP reports (Canada, US, Mexico, Eurozone), China’s PMIs, Australian CPI, European consumer spending, and Peru’s inflation. Not enough? There will also be global earnings reports including over 150 S&P500 releases, about five dozen TSX-listed companies in Canada, and many other global corporations.
The Q2 earnings season continues in earnest this week with over 150 S&P500 releases including four “Magnificent Seven” names: Apple (AAPL), Microsoft (MSFT), Amazon (AMZN), and Meta Platforms (META) and from Big Oil; Exxon Mobil (XOM), Chevron (CVX),
Central banks: Multiple central banks weigh in with decisions including the Federal Reserve, BoC, BoJ, Brazil, BCCh, BanRep and SARB.
Key indicators: US nonfarm payrolls, Core PCE, the Fed’s preferred inflation gauges, Eurozone inflation, GDP reports (Canada, US, Mexico, Eurozone), China’s PMIs, Australian CPI, European consumer spending, and Peru’s inflation.
Off-calendar risk could be resurrected with Israel and Iran lobbing bombs at each other.
Last Week of Note
Last week’s key U.S. Economic Reports:
Existing home sales decreased 2.7% month-over-month in June to a seasonally adjusted annual rate of 3.93 million (consensus 4.00 million) from a revised 4.04 million (from 4.03 million) in May. Sales were unchanged on a year-over-year basis. Median home sales price continued growing in June even though sales decelerated, which puts the spotlight on housing affordability at a time when mortgage rates remain high.
The weekly MBA Mortgage Index rose 0.8% after falling 10.0% a week ago. The Purchase Index was up 3.5% while the Refinance Index fell 2.6%.
Weekly crude oil inventories decreased by 3.17 million barrels after decreasing by 3.86 million barrels a week ago.
New home sales increased 0.6% month-over-month in June to a seasonally adjusted annual rate of 627,000 units (Briefing.com consensus 650,000) from an unrevised 623,000 in May. This leaves the pace of sales near the lowest level of the year, comparable to what was seen in October. On a year-over-year basis, new home sales were down 6.6%.
Initial jobless claims for the week ending July 19 decreased by 4,000 to a lowly 217,000 (consensus: 225,000). Continuing jobless claims for the week ending July 12 increased by 4,000 to 1.955 million.
The S&P Global U.S. Manufacturing PMI hit 49.5 in the preliminary reading for July, down from 52.9 in June. The S&P Global U.S. Services PMI hit 55.2 in the preliminary reading for July, up from 52.9 in June.
Weekly natural gas inventories increased by 23 bcf after increasing by 46 bcf a week ago.
Durable goods orders were down 9.3% month-over-month in June (consensus -11.0%) after an upwardly revised 16.5% jump in May (from 16.4%). Excluding transportation, durable goods orders were up 0.2% month-over-month (consensus -0.2%) after rising a revised 0.6% (from 0.5%) in May.
The sharp headline decrease was largely due to a drop in transportation equipment orders after a big jump in May, though nondefense capital goods orders, excluding aircraft—a proxy for business spending—fell 0.7% after increasing 2.0% in May, reflecting a moderation after a solid rise
NB: The Bureau of Labor Statistics that gathers, analyzes and publishes the price indices has recently advised that a hiring freeze by the Trump administration has resulted in fewer prices being checked. A larger share of the CPI basket is being estimated by prices for comparable products or prices in other regions of the country in lieu of harder data
Central Banks This Week
ECB left key interest rates unchanged in July monetary policy meeting, as expected; Deposit facility rate 2.00% Main refinancing rate 2.15% Marginal lending facility 2.50% Prior 2.50%. Domestic price pressures have continued to ease, with wages growing more slowly. The economy has so far proven resilient overall in a challenging global environment. Will follow a data-dependent and meeting-by-meeting approach to determining the appropriate monetary policy stance
Turkey’s central bank cut its one-week repo rate by 300bps to 43% (43.5% consensus). The 1-week repo rate had been reduced from 50% in December to 42.5% by March before a 350bps hike the next month.
Russia’s central bank cut its key rate by 200bps in line with consensus expectations.
Global Bond Markets Nervous
Treasuries and global bonds appear vulnerable. There is all the hallmarks os a “Global government finance Bubble”.
Quietly, China is pumping out record quantities of (globally impactful) Credit. China’s state-directed banks increased total assets $1.915 TN during Q1 to a record $63.920 TN, the strongest growth in two years. This pushed one-year growth to over $4.0 TN, or 6.7%.
Aggregate Financing, China’s metric for system Credit, expanded a stronger-than-expected $586 billion during June, up from May’s $319 billion and June ‘24’s $460 billion. First-half growth of $3.185 TN was up 26% from comparable 2024. Record one-year growth of $5.159 TN exceeds even pandemic 2020’s $4.852 TN. Historic Credit expansion belies all the China deflation talk.
Corporate Loan growth of $246 billion (up 8.9% y-o-y) was up from May’s $75 billion and June ‘24’s $227 billion, with first-half growth of $1.608 TN up 5% from comparable 2024. Consumer Loans increased $83 billion (up 3.0% y-o-y), up from May’s $8 billion and June ‘24’s $80 billion. Government Bonds surged $188 billion for the month, easily surpassing June ‘24’s $119 billion. Year-to-date growth of $1.067 TN more than doubled comparable 2024. Record one-year growth of $2.177 TN compares to pandemic 2020’s $1.162 TN.
Treasuries are also pressured by the influence the administration is trying to assert on the Fed. The relentless pressure to lower rates and the attacks on Powell unsettle the safe haven component of Treasuries. The demeaning tone towards the Federal Reserve has unappreciated costs such as for global investors concerns on the Trump administration Federal Reserve “reform” effort which drags the Fed into the political cesspool. Thus far the rabid leveraged speculating community appears to ignore the assault on Fed independence.
What that community sees is the inflating price levels, and bathing in it. By last week the Nasdaq100 has returned 18% since the Fed began cutting rates (9/18/24). Money Market Fund Assets have inflated $769 billion, or 15% annualized. Gold has surged 30.6%, Silver 25.1%, Platinum 40.2%, and Copper 33.0%. Bitcoin prices have almost doubled.
This helps us understand the fact that global bond markets are signaling a new paradigm of market yields increasingly disconnected from central bank policy rates. This has been notably since the Fed’s rate cuttung cycle last year, long before Trump. Loose monetary policies are no longer automatically transmitted to lower bond yields. Thare are multiple reasons here; surging bond issuance, mounting debt levels, and structurally elevated inflation risk via tariffs, though this has not come to the fore yet (and may not).
Central Banks are NOT Controlling Yields
What should be clear by now the Fed is not in control of the monetary inflation process. Indeed the QE experiment means the Fed has for decades accommodated history’s greatest Bubbles, with that come unprecedented leveraged speculation.
It is not just the Fed,
The ECB has cut rates 100 bps so far this year (to 2.15%), German yields have jumped 36 bps y-t-d.
The Bank of England policy rate was reduced 50 bps (4.25%), though gilt yields are up five bps.
The Bank of Canada has cut 50 bps (2.75%), and 10-year yields rose 28 bps.
The Reserve Bank of Australia has reduced rates 50 bps (3.85%), with 10-year yields down only four bps.
Japanese yields have surged 42 bps so far in 2025, after a 25 bps increase in the policy rate.
Inflate or deflate, Bubble dynamics will and have dictated the course of Federal Reserve policies. It would seem the Fed’s balance sheet is the only option for stabilizing system liquidity in the event of major speculative deleveraging. Though we have been hearing that since the 2008 bailout, the Fed for their part appears to whitle past the grave during periods of speculative excess and the resulting marketplace liquidity flooding.
Tariff Watch
Update: On sunday July 17 it was announced that a U.S.–EU trade deal was reached:
📜 Key terms of the deal via Illimar Mattus @IllimarM
15 % import tariff imposed on most EU goods entering the United States—down from a previously threatened 30 % across-the-board rate.
50 % tariffs remain in place on steel and aluminium from the EU, though these may later be shifted to quota-based measures .
Certain strategic categories — including aircraft components, semiconductors, generic pharmaceuticals, selected chemicals, critical raw materials and some agricultural goods—will be granted zero tariffs from both sides (“zero-for-zero” approach).
The EU commits to purchase approximately $750 billion in U.S. energy (notably LNG) over the term of Trump’s second term—roughly $250 billion per year—and invest $600 billion in U.S. assets, including military equipment.
The EU agrees not to impose retaliatory tariffs on U.S. goods and will adopt U.S. industrial and auto standards in certain sectors.
• The agreement was timed to avoid an imminent tariff escalation set for August 1, when the U.S. had planned to raise tariffs on EU goods to 30–50 %, depending on category.
Trump’s cascade of tariff orders has begun generating tens of billions of dollars a month in new revenue for the U.S. government. U.S. customs duties revenue topped $100 billion in the federal fiscal year through to June, according to U.S. Treasury data on Friday. However there isa price to pay, the tariffs have also strained diplomatic relationships with some of the closest U.S. partners.
Japanese Prime Minister Shigeru Ishiba said last week that Japan needed to lessen its dependence on the U.S. The fight over tariffs has also prompted Canada and some European allies to reexamine their security dependence on Washington, with some looking to purchase non-U.S. weapons system. This week we got more ‘tariff letters’ as Trump returned to a more aggressive trade posture with latest tariff threats
Historically July is a strong period for stocks.
Keep in mind however, this year has been predictably unpredictable with record highs on both the Nasdaq and S&P 500, additionally record highs on Australia’s ASX200 and the German Dax. Over the past 20 years, July has been the strongest month for the S&P 500 benchmark index with an average return of 2.5%, according to a Reuters analysis of LSEG data. Notably the sttock rally has been largely driven by retail investors and share buybacks, institutional positioning in equities remains underweight. This could be problematic for index mateches if the trajectory continues.
The second quarter earnings season starts in earnest in mid-July, next week will see results from the biggest banks..
There is little doubt President Trump is pumped with success, the danger is does this come off the rails or does his grand plan, assuming there is one, come together? He has seen the passage of the Big Beautiful Bill budget, judicial victories, and achieving a ceasefire between Israel and Iran. Next up is the center piece initial chapter in its dramatic changes of America’s foreign economic policy. The 90-day hiatus since Liberation Day has come to an end and tariff letters are flying.
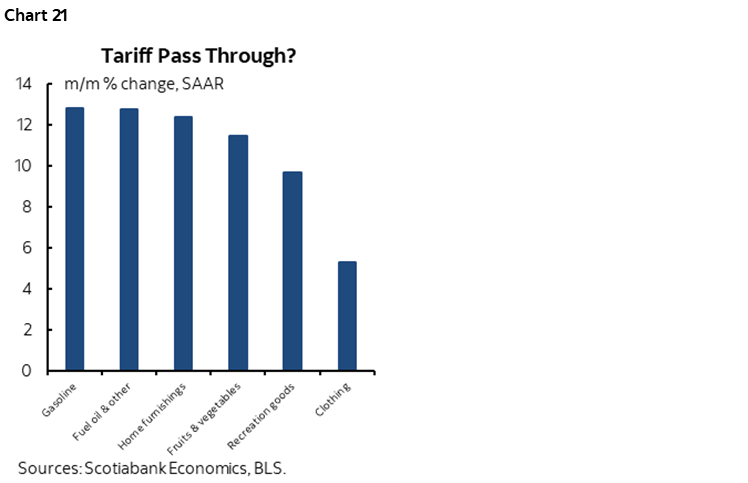
Despite Chairman Powell’s warnings the impact of the tariffs so far seems limited. We have seen some preliminary signs of pass through, April and May US import prices, excluding oil, rose by an average of 0.3%. In the previous four quarters, they rose by an average of 0.1%. Federal Reserve Chair Powell, who seems to be threatened daily by trump or by one of his ‘cronies’ has said that if it weren’t for the tariffs, the Fed likely would have continued to cut rates this year.
The continued resilience of the US labor market underscores the rationale of the Fed’s patience. If tariffs don’t reap inflationary damage a September rate cut remains the most likely scenario. The other big market news, after stock market records, is the falling US dollar largely in a recognition that the Federal Reserve will be resuming its rate cuts around the time other G10 countries finish their easing cycle, or nearly so. This in a market world were the majority came in the year long dollars.
The frontloading of tariffs and the increasing bitter domestic and geopolitical scenes has impacted the economic calendar. We saw a decline in consumer confidence in June, a surge in durable goods orders in May, a dip in weekly initial jobless claims, a downward revision to Q1 GDP, and a decline in real personal spending and an uptick in the year-over-year rates for the PCE Price Index and core-PCE Price Index in May.
A continuous question is will the Mid East ceasefire hold or do we see a deepening war? A deepening war would directly impact Iranian oil output vulnerability and a knock-on effect to China. That, and Russia in Ukraine add to the overarching message from Fed Chair Powell at his press conferences is that the Fed is going to stick by its wait-and-see stance, with a still robust labor market and tariff uncertainty.
Risk On Risk Off
We saw with the Israel attacks that risk is being played with blinkers on, FOMO is paramount for the herd. Those within the oil market were warning of inherent risks. Israel was basically telegraphing the attacks as was the US removing staff from the region the day before, yet crude options did not reflect this, either did futures markets, clearly to move 13% in one foul swoop.
There are today two notably powerful countervailing forces. The “risk on” squeeze dynamic is spurring speculative leveraging and the perception of abundant liquidity. At the same time global bond markets signal waning demand and fledgling liquidity issues. (the JGB and gilt issues were less than two weeks ago) Strong risk market gains, the perception of liquidity abundance, and attendant complacency work to mask mounting risks to Treasury and global bond market stability.
What also hasn’t changed is the concentration of ‘bets’. magnificent 7 or MAG7 related margin debt, options, and other related derivatives have produced extraordinary liquidity effects (money market fund assets up another $67bn the week ahead of the bombing, despite the TSLA nosedive). It all becomes self-fulfilling, until it doesn’t. Rising stock prices fuel self-reinforcing liquidity creation, while sell-offs heighten risks of illiquidity, deleveraging, and market dislocation. FOMO trumps all at his time.
The egregious Treasury “basis trade” leveraging drives unprecedented overall hedge fund leverage. Household market participation is unparalleled, with the proliferation of online accounts, options trading, and herd-like speculation creating extraordinary market-moving power.
“Citadel’s… CEO Ken Griffin said… it is ‘unfathomable’ that a financial instrument to protect against an eventual U.S. default is being priced at levels close to some European countries. ‘I never thought in my life I would see the U.S. priced higher in risk cost than a number of countries like Spain, Germany or France,’ he said… ‘You gotta be kidding me.’ Griffin said the credit default swap (CDS) market has some issues with liquidity which impact prices, but still he considered that conversations around how close the swaps are trading are ‘unfathomable’… ‘The United States’ fiscal house is not in order. You cannot run deficits of six or 7% at full employment after years of growth. That’s just fiscally irresponsible,’ he said.” June 5 – Reuters (Carolina Mandl and Davide Barbuscia)
From April 25th ‘24 lows to July 10th 24’ highs, the Bloomberg MAG7 Index surged 38%.
From July 10th highs to August 5th ’24 lows, MAG7 dropped 22%.
From August 5th lows to December 18th highs, the index surged 51%.
From December 18th highs to April 7th ’25 lows, MAG7 sank 33%.
From April 7th lows to Friday’s (June 6th) close, the index has rallied 35%.
Gambit [ˈɡambət] noun“a device, action, or opening remark, typically one entailing a degree of risk, that is calculated to gain an advantage’
Crises of Confidence:
The reasons are many, investor anxiety over U.S. fiscal health increased following the passage of a substantial tax-and-spending bill in the House, which is projected to significantly increase the national debt. This followed Moody’s downgrade of the U.S. credit rating and a weak Treasury bond auction fueling weakness in the U.S. dollar, enhancing gold’s appeal. The concern is the tax bill would add trillions of dollars in coming years to already ballooning budget deficits at a time when investor appetite is waning for US assets across the globe.
Committee for a Responsible Federal Budget: “The Congressional Budget Office (CBO) released its first comprehensive estimate of the House’s Fiscal Year (FY) 2025 reconciliation bill – the One Big Beautiful Bill Act – finding that before accounting for interactions, the bill would add $2.3 trillion to deficits over the next decade. Incorporating our estimates of interactions and the adjustments announced by House leadership Monday, we estimate the bill would add $3.1 trillion to the debt as written.” May 21
Geopolitical contagion impacts
Prospects for inflation are both troubling and highly uncertain, Fed Chair Powell made that clear during his sit down this week. The trade war with China will accelerate decoupling between the world’s great consumer and producer economies, a dynamic conducive to supply-chain problems and ongoing inflationary pressures. A seizing up of global markets has the potential to unleash the forces of economic depression and deflation. Globalization has been a powerful force for lower goods prices., something that in rebuilding the U.S. industrial base would see a high-cost producer replace a low-cost producer.
April 16 – Financial Times (William Sandlund and Chan Ho-him): “Donald Trump’s on-off tariffs have pushed currency volatility to multiyear highs and boosted demand for foreign exchange hedging products as companies struggle to adjust to market swings. Currency volatility has surged in recent days to levels last reached during the collapse of Silicon Valley Bank and Credit Suisse in March 2023… The uncertainty around Trump’s tariffs has created more demand for FX hedging products to offset sudden fluctuations in exchange rates that are hitting businesses with global operations, according to banks and executives at multinational companies.”
April 8 – Bloomberg (Vassilis Karamanis): “Currency traders are positioning for turbulence in currency markets to get even worse as an escalating trade war shakes up the global economic order. The dollar and its peers have been whipsawed by some of the sharpest price swings since the 2008 financial crisis… Options volumes surged to a record last week and uncertainty around the trade war has now pushed expectations for volatility in the next month to a two-year high. ‘Volatility in FX has been completely insane,’ Brent Donnelly, president of Spectra FX Solutions LLC., wrote… ‘We saw one of our biggest weeks ever on the trading side as volumes are gigantic and everyone is doing all kinds of stuff.’”
Tariff Watch
On May 12th, the US administration’s ’90-day fiancé’ deal postponed higher tariffs on China until mid-August by dropping the tariffs to 30% from 145% while China reduced its tariffs to 10% from 125%. Exporters are not sure whether this is a thaw that is possibly on the path to a grander deal, or whether tariffs could be jacked up again if Trump intensifies tensions once more.
Trump’s initial “reciprocal” tariff announcement included exemptions for semiconductors and other sectors, to which Trump has regularly pledged to apply a specific tariff. He hasn’t yet done so but the latest exclusions are related to that exemption.
China Deal In Switzerland both the U.S. and China agreed to a 90-day reduction in tariffs, effective Wednesday. The U.S. is dropping tariffs on China from 145% to 30% and China dropping tariffs on the U.S. from 125% to 10%. The reductions were larger than expected and we expect stock and commodity markets to gap up significantly when markets open. The sobering news for the market is that the reductions expire in 90 days if both sides can’t reach a more permanent trade deal.
The biggest category related to China is smartphones. The US imported smartphones valued at more than $41 billion from China in 2024, or about 9% of total imports from China. Also covered are computers and similar devices, of which the US imported more than $36 billion in 2024.
Altogether the exemptions cover consumer electronics and semiconductors that accounted for about 22% of US imports from China in 2024, DiPippo said.
Also crucial are exemptions on semiconductor manufacturing equipment, made by companies such as ASML Holding NV in the Netherlands and Tokyo Electron Ltd. in Japan. Those tools are essential for building chip factories and comprise the lion’s share of the multibillion-dollar price tag for such plants. Companies including TSMC, Samsung, and Intel Corp. are building new US facilities with support from the 2022 Chips and Science Act.
FOMC Presser Chair Powell (Pre Trump-Tariffs) said this:
“It is going to be very difficult to have a precise assessment of how much is coming from tariffs. Goods inflation moved up this year but it’s very challenging to trace it back to non-tariff inflation versus tariff inflation. In terms of looking through, it’s too soon to say that. Sometimes it’s appropriate to do that. That would depend on tariff inflation moving through pretty quickly and longer-term inflation expectations being well anchored.”
He went on to note that “We were getting closer and closer to price stability but we were not at that. The arrival of further tariff inflation could delay this. The forecast does show us getting into the low 2s further out.” And so the message is that for now they are erring on the side of caution by raising inflation and becoming more patient on timing further easing.
Central banks are hamstrung by elevated inflation and trade war risks. No time like the present, no less than eleven global central banks will weigh in with monetary policy updates this week. This includes three of the big dogs, the Federal Reserve, Bank of Japan and the Bank of England. Patience is required given the uncertainty and the many possible burifications from how they act and communicate. No doubt, whether as an excuse or because they genuinely are, less confidence in the path forward will feature prominently in the communications.
A dangerous market for those not trading with discipline and booking profits. Not one with emotion and preset views dictated by hope, politics or a talking head’s opinion.
The key personal income report for May had a stagflation smell about it, a poor report for the growth outlook and a poor report for the inflation trend. That leaves the Fed between a rock and a hard policy place, yet given the Fed’s attention to inflation concerns at this juncture, it seems like a report that will keep the Fed reluctant to cut rates at its July FOMC meeting.
Personal income declined 0.4% m/m in May (consensus +0.4%) following a downwardly revised 0.7% increase (from 0.8%) in April. Personal spending declined 0.1% (consensus +0.2%) following a 0.2% increase in April. Real personal spending declined 0.3%, which will be a drag on Q2 GDP forecasts. The PCE Price Index increased 0.1% m/m, as expected, but the core-PCE Price Index jumped 0.2% m/m, which was higher than expected (consensus 0.1%). Those moves left the PCE Price Index up 2.3% y/y, versus 2.2% in April, and the core-PCE Price Index up 2.7% y/y, versus 2.6% in April.
Q1 productivity decreased 1.5% (consensus -0.8%) v prelim 0.8% decrease. Unit labor costs were revised up to 6.6% (consensus 5.7%) from the preliminary reading of 5.7%. A bad combination with stagflation undertones that will complicate the Fed’s assessment of the overall economic picture and what to do with its policy rate.
The trade war has piled onto stagflation fears that came with the previous week’s PCE data. Concern that Trump’s trade war will trigger a worldwide recession are weighing with the risk that the same punitive tariffs may unleash another bout of inflation. US government debt rallied hard. which is critical to the Trump strategy to bring down rates as they need to rollover debilitating trillions of dollars of U.S. debt.
The two-year yield hit the lowest since 2022, traders are pricing in a greater chance the Federal Reserve moves most aggressively to cut interest rates to keep the economy from stalling. 10-year yields tumbled below 4% for the first time since October. This however is ignoring Fed Chair Jerome Powell’s comments about the inflationary impact of tariffs at their own peril.
Stagflation risks came back to the fore hurting markets after the Personal Consumption Expenditures report was good on the income side, but the spending side is just hanging in there (real PCE up just 0.1%) and was bad on the inflation side with the uptick in the core-PCE Price Index (the Fed’s go to) by 0.4%, bringing the annual rate to 2.8%. Potentially mixing toxic cocktail to stir some stagflation angst for the Fed in a wait-and-watch mode on rates.
With all the negative press, job and inflation worries the Consumer Confidence Index understandably revealed a fourth consecutive decline. The Expectations Index fell to its lowest level (65.2) in 12 years, with future employment prospects and inflation concerns weighing.
We have seen the basis trade burst at its seems and the lifting of reciprocal tariffs as crisis dynamics gain momentum. At this juncture the Fed and global central bank community will be faced with having to aggressively expand their balance sheets to accommodate speculative deleveraging and counteract acute systemic stresses. Markets seem to be taking the proven bet that the Fed will be forced into another aggressive round of QE despite elevated inflation risk to counter global market instability and deleveraging.
Stress remains almost across the board with “carry trades”, “basis trades” and especially the “swaps” derivatives marketplace. We have seen some unwinding the massive “basis trade” in Treasuries. To reiterate what we saw last week volatility so far seems about price discovery in the wake of US policy shocks rather than signs of market dysfunction
Debt …. Keeps Building
An overheating economy, coupled with tariff and trade war risks, creates a bond market challenge.
“Chuck E. Cheese owner CEC Entertainment is struggling to drum up enough demand for a $660 million high-yield bond sale to refinance debt it has due next year, according to people familiar… JPMorgan… and Goldman Sachs…, the banks leading the deal, had not obtained sufficient orders from investors… One of the people attributed the difficulties to a broader market rout stemming from concerns about the Trump administration’s tariff policies as well as the US economy… Other transactions in the leveraged finance market that are vulnerable to a dip in consumer spending, including casino operator Mohegan Tribal Gaming Authority, have faced investor pushback lately partly because of concerns about the US economy.”March 28 – Bloomberg (Aaron Weinman and Gowri Gurumurthy):
“Several Southern California cities have the most credit card debt per household in the U.S., a new WalletHub study found. Santa Clarita ranked first out of 181 U.S. cities, with a household average of about $22,753 in credit card debt, and a total of about $1.7 billion in debt for its 228,000 residents, according to data taken from the U.S. Census Bureau and TransUnion… Chula Vista was second, with an average of $20,567 in credit card debt per household, and a total of $1.8 billion among its 275,000 residents.” March 21 – Los Angeles Times (Sandra MacDonald)
Was DeepSeek the beginning of the end of the AI Speculative Bubble?
Google response to DeepSeek
Alphabet’s Google launched two new AI models on March 12 for robotics applications on its Gemini 2.0 model. Last month robotics startup Figure AI exited its collaboration agreement with ChatGPT-maker OpenAI after it made an internal breakthrough in AI for robots.
Gemini Robotics is an advanced vision-language-action model that will have physical actions as a way to provide output. The second model, Gemini Robotics-ER, will enable a robot to have an advanced understanding of the space around it and lets developers run their own programs using reasoning abilities offered by Gemini 2.0.
Google said its models are designed for robots of all form factors including humanoids and other types used in factories and warehouses. Apptronik raised $350 million in a funding round last month led by B Capital and Capital Factory, with participation from Google to scale production of AI-powered humanoid robots.
Discipline with your trading rules, especially as liquidity falls
There is a reason we have strict trading rules here based on psychology, math, experience and avoiding false narratives and dribble out there. That said pay attention to the time of year, the bonus pay dates (no we aren’t being cynical), tax markings and look the previous run ups into Dec 31. Don’t let the grifters out their sway you, VIX is historically low, what does that tell you? Protection is cheap and the market is complacent with no fear. Here endeth the lesson.
Two paths to bankruptcy: gradually and suddenly. – Ernest Hemingway
Where is the Fear in Instability?
Leveraged speculation, including “basis trades,” “carry trades” and run deep and why the yen and Mexican peso are deeply relevant to this whole structure.
“Credit-default swaps in Asia blew out the most since the worsening of the Covid-19 pandemic in 2020… The cost to insure investment-grade debt of Asian issuers outside Japan widened by 26.5 bps on Monday, according to traders, deeper than the 22 bps in earlier trading. If that level holds, it would mark the biggest single-day jump since March 2020…” April 6 – Bloomberg (Ameya Karve, Finbarr Flynn, and Kari Soo Lindberg):
Compressed risk premiums and CDS prices are indicative of complacency. Markets behave this way when there is some underlying monetary disorder (dislocation in liquidity creation). What all this does for markets is keep risk measures on, we see in the vicious VIX fails and short-term option volumes. It is when the risk avoidance measures, or tolerance fails this can trip up the whole structure of buying and cycling through risk assets.
In the backdrop we have war abroad in the Ukraine and Middle East, unsettled relations between Taiwan and China. At home in the US universities and cities to the North have become a quagmire of protest, illegal immigration placement and political vitriol that have deeply divided these regions. The cost of living through it all has sent many working through middle class families to the brink and beyond, insurance costs have risen over 100% in a year in some cases to name just one inflation cost that politicians lie about.
While complacency reigns supreme in equities, bonds are awake to the risk out there.
The CBOE Volatility Index (16.66, -1.82, -9.9%) is trading at its lowest level since February, as market participants are backing off pursuits to use options to hedge against downside risk after the better than feared May employment report and the S&P 500’s move above 6,000 that puts its all-time high of 6,147.43 in relatively close reach.
“We have a market trying to interpret the Fed who is trying to find out how they can interpret their long-only portfolio at a risk parity where rates cannot rise.”– MoneyNeverSleeps
Our weekly reminder for risk, timely given the V shape to ATH. The downside is clear with the absence of moral hazard from repeated Federal Reserve market bailouts in an environment of some would say obscene liquidity pumps. Pure greed is the other part, not wanting to miss out on fees. The obvious question is, how deeply ingrained is this attitude through the markets? How do we ween the markets off this continuous dip feed? At this point the Central Banks have kicked that answer down the road.
Our take remains the Fed is not just focused on inflation but risks such as the commercial real estate debacle, the high US dollar and the massive Federal debt refunding cost.
We need to grasp all the risks to be wary of but not ignore price reaction. We always talk here about expect the unexpected and now that is front and center, gage the market’s reaction, the market is always right and that’s why we focus on the crowd psychology aspect.
Unsuspecting investors in their millions have or will lose meaningful amounts of their savings. They bought into the mania, threw caution to the wind, and will suffer the consequences regardless of the warnings of unsustainability. The reason we started TradersCommunity was for situations like this many moons ago. Beware of those ‘experts’ who never saw the sell off and chided you for believing it now claim to be gurus measuring risk. It’s a bit late when some of these stocks and markets are down 50-90%. Beware of those who claim long term investment when it all goes wrong. Anyhoo..
Oh China
China has gone from bad to worse. Back in September 2024 Xi Jinping promised to spend whatever it takes to reach growth targets as he tapped the reflation panic button. A Reuters article placed Beijing’s stimulus at $1.4 TN. On top of a system locked in massive credit expansion, upwards of $5 TN annually. He is pushing hundreds of billions to the stock market, hundreds of billions to the festering local government sector, hundreds of billions to the to attempt to arrest the slide in the apartment markets.
January 31 2025 – Bloomberg: “China’s residential sales resumed falling in January… The value of new-home sales from the 100 biggest real estate companies dropped 3.2% from a year earlier to 227.6 billion yuan ($31.4bn), after being flat in December… Beijing is struggling to revive the property market amid weak domestic demand and a worsening job situation. While the housing sector has picked up modestly on the back of government support, improvements have mostly been in the second-hand market as buyers remain concerned about developers’ ability to finish projects on time.”
January 27 2025 – Financial Times (Thomas Hale and Chan Ho-him): “Leading Chinese property developer Vanke has forecast a $6.2bn annual loss and announced the sudden resignation of its top leadership, reigniting concerns over funding and confidence across China’s economically critical real estate sector. The developer, partly owned by local authorities in Shenzhen, is the latest focal point of a cash crunch that began with the collapse of peer Evergrande in 2021 and has since engulfed a host of other developers including Country Garden. After weeks of swirling concerns over the health of Vanke, the company said… chair Yu Liang had resigned for ‘work adjustment reasons’. It said chief executive Zhu Jiusheng had departed for ‘health reasons’. The ‘sudden and simultaneous’ resignations were ‘unprecedented in recent memory’ for a big participant such as Vanke, said Foreky Wong, founding partner at Hong Kong advisory company Fortune Ark Restructuring.”
January 28 2025 – Bloomberg: “China Vanke Co. has been thrown a lifeline by state authorities, a rare show of support that signals the developer may be too big to fail even after dozens of property firms defaulted amid China’s punishing housing slump. As part of an overhaul unveiled late Monday, Vanke’s two top veteran executives stepped down after the company warned of a record $6.2 billion loss. An official from Shenzhen Metro Group Co., its largest state shareholder, will take over as chair.”
Meanwhile;
December 18 – Financial Times (Demetri Sevastopulo): “China has increased its arsenal of operational nuclear warheads to 600 from 500 in just a year, as the People’s Liberation Army continues a rapid expansion of its forces, according to the US defense department. In its annual ‘China Military Power Report’, the Pentagon said the PLA had expanded its arsenal by 20% in the 12 months from mid-2023 and was on track to have 1,000 operational warheads by 2030. The Pentagon has in recent years warned that the US will soon face two nuclear peers as China’s arsenal grows closer in size to the US and Russia.”
December 16 – Reuters: “China’s capital markets outflow reached a record high of $45.7 billion in November, according to official data tracking cross-border payments, as Donald Trump’s U.S. presidential election win roiled global portfolio flows. Cross-border receipts from portfolio investments were $188.9 billion, while payments totaled $234.6 billion, resulting in the biggest monthly deficit on record…”
Any pushback to fledgling tightening these days ensures excessively loose financial conditions.
With bullion down $6, the HUI gold index fell 2.1% (up 52.8%).
W/E July 25 2025
S&P 500 stocks First Half of 2025
Highlights – Europe Stocks
U.K.’s FTSE equities index gained 1.4% (up 11.6% y-t-d).
France’s CAC40 added 0.2% (up 6.1%).
German DAX equities index slipped 0.3% (up 21.6%).
Spain’s IBEX 35 equities index rose 1.8% (up 22.8%).
Italy’s FTSE MIB index gained 1.0% (up 19.1%).
Highlights – Asia Stocks
Japan’s Nikkei 225 Equities Index surged 4.1% (up 3.9% y-t-d).
South Korea’s Kospi added 0.3% (up 33.2%).
India’s Sensex equities index declined 0.4% (up 3.8%).
China’s Shanghai Exchange Index gained 1.7% (up 7.2%).
Highlights – Australian Stocks
Australia’s ASX 200: Friday +1.4% to 8757.20 (+2.1% on the week)
Strongest weekly gain since May after a third record close this week, driven by a rebound in heavyweight CSL and BHP.
Friday: BHP rising 3% to $40.29 after reporting record output across its key commodities. Copper production lifted 8% to an all-time high of 2.01 million tonnes, Western Australia Iron Ore division delivered 290 million tonnes despite earlier cyclone disruptions. Iron ore hit a three-month high after Henry said demand for commodities remained resilient in 2025, underpinned by strength in China.
All 11 sectors finished in the green, with health care the standout. CSL jumped 3.6 per cent to $257.38 for a weekly gain of 7 per cent – its best since December 2021 – after UBS reaffirmed its buy rating and $310 price target.
Commonwealth Bank (ASX)
The stock of Commonwealth Bank bounced to close to 182.46 up from $178 the prior Friday. CBA is down from its intraday record of $192. This comes after the Reserve Bank meeting, where there wasa surprise no rate cut.
Highlights – Emerging Markets Stocks
Brazil’s Bovespa index was little changed (up 11.0%),
Mexico’s Bolsa index rallied 1.9% (up 15.8%).
Turkey’s Borsa Istanbul National 100 index jumped 2.7% (up 8.3%).
Technical Analysis
Technical Analysis of key markets via KnovaWave
S&P 500
Daily: The SPX has traded like clockwork hitting the 78.6% extension right on cue into election.
Background: The move fueled by the violent ABC for the 5 waves up for SPX continue right into bottom of the median line to give us an (a) or C of a 4. with impulse after completing 5. Reversed hard with energy fueled from the power impulse down from near +1/8 ATH. On the way up (just like down) It accelerated after it broke the Tenkan through the rejected Kijun and then the Kijun to close back over the median and 8/8. Bulls this was a (ii) of a 5. Bears this is a a-b of a C off a completive V of degree. We watch if this low was a (iii), (a) or C. Will determine if sharp ABC completed off all-time highs. We have to respect the number of alternatives of degree of 5. With such trends keep it simple support is Tenkan and Kijun and watch for ABC. No fear is the driving element.
The break up was from above the 200dma. The balance from sharp reversal after the initial 3 wave down from the SPX wave 5 extension as Covid19 fed impulse accelerated under the Tenkan. From there we had seen the ABC or 1-2-3 spinning around the 61.8% of the move. Support began at the October 2019 lows. A manic wave 5 or 3 of some degree was a resolution for the ages. Note the 100% extension from the emotive element and MM levels when the spit kicks in. A manic wave 5 or 3 of some degree was a resolution for the ages. Note the 100% extension from the emotive element and MM levels when the spit kicks in
Weekly: The weekly confirms the daily sequence into the 78.6% extension.
Background: The reenergized SPX tripped in 3 to test recent break up at Tenkan from there we had had a powerful rally to ATH. Again notice what happened “Each new high has evolved after testing Tenkan key support which is the next line after Friday’s dump & minor bounce.” We watch for a spit of a spit Extensions are difficult to time, keep it simple.
Key for the impulse higher was the spit or retest of MM 8/8 and Tenkan San, which held with the previous highs and Tenkan. To repeat “We look for 3 waves down and reactions to keep it simple with the alternatives in the daily.” Keep an eye on the put/call ratio with recognition to the sheer size of contracts AND keep in mind the stimulus distortion. The spit per channel fractal and Adams rule launched back over the cloud where we were encased AND we back tested it. Watch if a spit or clear break support as Chikou rebalances
Dow Jones
NVIDIA (NVDA) and Sherwin-Williams (SHW) replaced Intel (INTC) and Dow Inc. (DOW) in the Dow Jones Industrial Average starting on Friday, November 8, 2024
NASDAQ 100
The Nasdaq100 (NDX) declined 2.4% this week, closing at 19,281, only 56 points, or 0.3%, above the March 13th close. From March 13th lows to this week’s (Tuesday) high, the NDX rallied about 6%, a so far notably unimpressive rally from the previous steep one-month decline (from the 22,223 February 19th high). The Bloomberg MAG7 Index closed the week only slightly above March 11th intraday lows, with the S&P500 ending the week 1.4% off March 13th trading lows. At this critical market juncture, further weakness risks acute instability. – March 28
Background: Fuel was after it broke and held the weekly Tenkan to see a spit of a spit fail which is completive of 5 of some degree with Chikou rebalancing. From there we sold off right to Tenkan (as did SPX) and bounced hard Support Tenkan to Kijun. Watch Chikou for divergence for continuation or failure. Divergence with Russell also a clue.
Russell 2000
The small cap Russell RUT broke out of multi-year flag and then spat the previous high. Unlike SPX and NDX we could not get to new ATH until near the end of this cycle after it got through Tenkan and Kijun on the bounce. This is the index showing more of the fast money crowd and is trading like it. Needs to get traction in here for bulls. Support +1/8 through 7/8 (cloud base)
US Stocks Watch
Investors (and algos) will focus on the conference calls and outlooks. Last quarter everyone expected the worse, we saw critical updates on production in coronavirus impacted regions and if there is extended halting of operations weighing on multi-nationals.
NVidia $NVDA
Nvidia Shares are up roughly 28-fold in the past five years. They completed a potential double top spitting the 4.618 fib extension. That said timing the impulse is one of patience, discipline and usually hindsight.
The surprise here was it came over the Luna New Year break. The Chinese AI DeepSeek was listed for free and went top of the Apple & Google app stairs. Panic ensued and NVidia finished down 17% Monday, the biggest loss of market capitalization in history with a $560 billion evaporation. The Semiconductor index sank 9%. NVDA shares performed a dead cat bounce at best and closed 15.8% lower at the end of the week.
The impact was amplified given trading had boomed in products that allow investors to amp up bets on the world’s most popular equities, with investors pouring a record of more than $6.5 billion into such “single-stock ETFs”, vehicles that track just a single company but use derivatives to intensify bullish or bearish wagers. A major winner in this category was a fund from GraniteShares, which provides two times the daily returns of market powerhouse Nvidia Corp. The strategy, which trades under the ticker NVDL, saw assets explode to a peak of $6.7 billion in late November 2024, with returns in excess of 350% that year. Funds tracking MicroStrategy, Tesla Inc. and Coinbase Global Inc. have followed similar paths.
The move tracked by the KnovaWave extension model followed the announcement of NVDA 4/1 split come levels off the energy break NVidia hadn’t looked back with many gaps below until it hit the 2.618 target of the exhaustion phase. We saw another power move off the $200 retest (old $800) & earnings off $300 which retested. It is a clear leader of SOX SMH look for cues there and ABC failures for changes.
Apple $AAPL
Apple gently motored up to new ATH over the massive $160 then $170 thru to $180 gamma level to new ATH. These levels will be key energy levels. Support from previous highs, resistance now Fibs and Murrey Math levels. Remember the impact $AAPL has, at least short term on all the major indices.
Tesla $TSLA
In the second half, mom and pop then ditched financial companies en masse – only for the cohort to ride the “Trump trade” wave and become the S&P 500’s biggest gainers between July and November 2024. And like many investors during the brief market crash in August, the retail crowd panic-sold some of their hottest assets, including Nvidia and Tesla – all at the lows. That proved painful. Shares of Elon Musk’s EV-maker, for example, have almost doubled since then.
Wrong-sided positioning like this has pushed the retail group’s gains in 2024 to a mere 9.8%, according to Emma Wu, a quantitative and derivatives strategist at JPMorgan, and colleagues. That’s their second-weakest performance in any year when the index posted a positive return since 2015.
Exxon Mobil $XOM
Part B: Bond Markets
Global Bonds This Week
Highlights – Treasuries
“Bundesbank President Joachim Nagel said a strong US Treasuries market is good for everyone, even as investors have turned to German bunds. ‘It is not good news that there is a lot of doubt regarding the safe haven of US Treasuries,’ he told Bloomberg Television… ‘We need a good US Treasuries market. This is so important for the financial markets worldwide.’” April 23 – Bloomberg (Jana Randow, Mark Schroers and Lisa Abramowicz):
U.S. Treasuries finished the week with 10s and 30s padding this week’s modest gains while the 2-yr note finished flat, ending the week with a modest loss.
Weakness in European equities and sovereign debt amid growing expectations that the European Central Bank will not make another rate cut before Q4. Longer tenors spent early trade in a sideways range, rising to fresh highs in the late morning in a move that coincided with a push to fresh record highs in the S&P 500 and Nasdaq.
30-yr yield finishing just above its 50-day moving average (4.925%) while the 10-yr yield fell below the 50-day moving average of its own (4.408%), settling not far above its 200-day moving average (4.371%).
This week’s action compressed the 2s10s spread by eight basis points to 47 basis points.
Crude oil finished in the red, giving up $0.86, or 1.3%, for the week,
U.S. Dollar Index rose 0.3% to 97.69, narrowing this week’s loss to 0.8%.
Total money market fund assets added $9.2 billion to $7.075 TN. Money funds were up $921 billion, or 15.0%, y-o-y.
Total Commercial Paper declined $9.7 billion to $1.395 TN. CP has expanded $307 billion y-t-d and $87 billion, or 6.7%, y-o-y.
Yields at W/E:
2-yr: UNCH at 3.92% (+4 bps this week)
3-yr: -1 bp to 3.86% (+2 bps this week)
5-yr: -2 bps to 3.95% (-1 bp this week)
10-yr: -2 bps to 4.39% (-4 bps this week)
30-yr: -2 bps to 4.93% (-7 bps this week)
NB: At Close 7/25/25
Highlights – Federal Reserve
Federal Reserve Credit declined $3.0 billion last week to $6.612 TN. Fed Credit was down $2.278 TN from the June 22, 2022, peak. Over the past 306 weeks, Fed Credit expanded $2.885 TN, or 77%. Fed Credit inflated $3.801 TN, or 135%, over the past 663 weeks.
Fed holdings for foreign owners of Treasury, Agency Debt dropped $12.4 billion last week to an eight-year low $3.218 TN.
“Custody holdings” were down $92 billion y-o-y, or 2.8%.
Updated 7/25/25
Highlights – Mortgage Market
Freddie Mac 30-year fixed mortgage rates slipped a basis point to 6.74% (down 4bps y-o-y).
Fifteen-year rates fell five bps to 5.87% (down 20bps).
Bankrate’s survey of jumbo mortgage borrowing costs had 30-year fixed rates down three bps 6.83% (down 43bps)
Updated 7/25/25
President Trump working on taking Fannie Mae and Freddie Mac public, “want to be clear, the U.S. government will keep its implicit guarantees” via Truth Social May 27
“The Fannie Mae 30-year current-coupon spread to the 5/10-year blend widened 6 bps to +160 as the U.S. Treasury 10-year yield rose 11 bps to 4.29% and volatility rose. The spread was the highest in more than 13 months. Volatility was the highest in about 18 months.” April 11 – Bloomberg:
“Mortgage rates slingshot higher as tariff uncertainty roils markets.”
“Brutal Week Sees Junk Debt Refinancing Costs Double in 2025.”
“Cracks Are Forming in CLO Market as ETFs on Record Selling Spree.”
“Investors lose $25bn in leveraged ETFs in sector’s biggest meltdown.”
“The World Is Different Now’: Market Convulsions Hit Wall Street.”
The Fed is effectively throwing additional fuel on historic speculative manias. Central banks have been adding liquidity to avoid systematic failure.
Highlights – European Bonds
Italian 10-year yields were unchanged at 3.55% (up 3bps y-t-d).
Greek 10-year yields added a basis point to 3.39% (up 18bps).
Spain’s 10-year yields were unchanged at 3.31% (up 25bps).
German bund yields increased two bps to 2.72% (up 35bps).
French yields dipped a basis point to 3.39% (up 19bps).
The French to German 10-year bond spread narrowed three to 67 bps.
U.K. 10-year gilt yields declined four bps to 4.64% (up 7bps).
Updated 7/25/25
Highlights – Asian Bonds
Japanese 10-year “JGB” yields jumped six bps to 1.61% (up 50bps y-t-d).
Updated 7/25/25
July 23 – Reuters (Rocky Swift and Gregor Hunter): “Japanese government bonds tumbled on Wednesday, sending benchmark yields to near 17-year highs, as traders priced in increased political risks and a hazy outlook for the central bank’s policy normalisation path. In a sign of how nervous markets are, the Ministry of Finance’s first sale of super-long government debt since a bruising electoral defeat for Prime Minister Shigeru Ishiba logged the weakest demand in almost 14 years… The 10-year JGB yield jumped as much as 10 bps to 1.6%, marking its biggest move in months and the highest level since October 2008. Super-long term JGB yields hit record highs in May and are back near those levels… ‘We’re seeing a possible buyers’ strike playing through,’ said Chris Weston, head of research at broker Pepperstone.”
Japanese Bonds Surged May 27 on signs that finance ministry may be prepared to adjust debt issuance following a rout in JGB market. Japan’s 20-year bond yield slid as far as 2.31%, down from 2.6% on Friday. The yield on the 30-year tenor dropped 18 basis points to 2.855%, after reaching the highest level since inception last week.
Junk Bond Market Euphoria
Financial conditions have loosened dramatically since April’s market tumult.
July 21 – Bloomberg (Rachel Graf): “About $61 billion of US leveraged loans hit the market Monday, the second-most ever…, as junk-rated borrowers continue rushing to lower borrowing costs by repricing existing loans. There were 33 launches…, with all but six of them repricings. The largest was a $7.57 billion offering for medical supplies giant Medline, the bulk of which will be used to reprice a term loan.”
July 25 – Bloomberg (Gowri Gurumurthy): “US junk bonds are headed for their second week of gains after steadily rising for six straight sessions… The broad gains were… partly fueled by large cash inflows into US high yield funds in 11 of the past 12 weeks. The funds reported a cash haul of more than $900m for the week ended July 23… CCC yields, the riskiest tier of the junk bond market, dropped to a three-week low of 10.66% after steadily declining for four sessions. CCCs are on track to rack up their seventh week of gains, the longest streak since October… The market priced nearly $9bn in four sessions this week, making it the busiest week since mid-May. The month’s volume is $27.5b. This will be the busiest July since at least 2021.”
July 24 – The Bond Buyer (Jessica Lerner): “Fears about changes to the tax exemption, shifting macroeconomics, growing capital needs and inflation-induced added costs to complete projects… led state and local government issuers to bring debt at a record pace, with issuance already on track to break 2024’s record $500-plus billion. The volume currently stands at $310.166 billion, up 17.4% from $264.151 billion at the same time last year. Now that the second half is underway, several firms revisited their supply projections for the year…”
After spiking to 453 bps, junk bond spreads sank 24 bps this week (4 sessions!) to 268 bps, the narrowest since February 20th.
Investment-grade spreads narrowed eight to 77 bps, matching the low back to December 18th – and closed Thursday only three bps above multi-decade lows.
Leveraged loan prices closed the week at highs since February 27th.
Bank CDS prices have dropped back to March levels – at home and abroad. JPMorgan CDS traded back down to 41.5 bps (April 9th high 71), the low since March 10th. At 99.25 bps,
European (subordinated debt) Bank CDS are down from an April 7th 169 bps high – to the lowest level since March 5th.
July 4 – Bloomberg (Gowri Gurumurthy): “US junk bonds racked up gains for the 10th straight session as investors poured cash into the asset class… Yields hit a nine-month low of 6.99%… US high-yield funds took a cash haul of $3.5b for week ended June 25, the largest weekly inflow in 18 months. It was the ninth consecutive week of cash flows into these funds… The market has already priced $6.6b in just three sessions this week after a flurry of issuance in June made it the busiest month since September 2021.”
July 1 – Financial Times (Euan Healy): “Sales of risky European corporate debt surged to their highest ever level in June, as lowly rated companies take advantage of a capital flight out of US markets… Issuance by high-yield, or junk-rated, companies — many of which have previously struggled to access the market — rose to about €23bn in June, according to JPMorgan… That beats the previous monthly record, set in June 2021, by roughly €5bn. June also saw the greatest number of deals on record at 44… ‘The market is drowning in new deals,’ said an investor at a European credit hedge fund.”
Cocoa and coffee brought inflation to the consumers drinking and and eating habits as companies passed on the price rises.
Cocoa
Cocoa futures were the best performing in 2024, surging by 176% for the year. Since then, we have had a vicious pullback. of around a 1/3 or $4,000. Cocoa a great example of how controlled or limited surplus can determine price. Africa produces 60% of global cocoa and nearly half of the world’s cocoa comes from just two West African countries, Côte d’Ivoire and Ghana.
The surge in 2024 cocoa prices was due to political and weather disruptions in West Africa. The crops were already struggling thanks to underinvestment in cocoa farms with growers struggling to replant diseased trees.
Coffee
Coffee futures followed cocoa higher and was up 73% for 2024, reaching a 47-year high as markets grappled with persistent supply concerns in key growing regions. While it has corrected off those highs in 2025, not to the extent of cocoa. The premium bean, arabica futures price doubling in 2024. Extreme weather in Brazil and Vietnam affected supply whilst demand was pressured by booming demand in markets like China.
Orange Juice OJ
BDI Freight Index
The Baltic Exchange’s dry bulk sea freight index, which tracks rates for vessels transporting dry commodities, steady at 2,257 on Friday, its third straight weekly gain.
The capesize index, which typically transport 150,000-ton cargoes such as iron ore and coal, rose 1% to 3,829, the highest in over a year, and surged 24% for the week.
The panamax, which usually carry 60,000-70,000 tons of coal or grain, index fell 2.3% to 1,838, ending the week down 4.2% after four weeks of gains.
Among smaller vessels, the supramax index dipped 0.3% to 1,294.
Copper is the bellwether industrial metal and moves on supply risks and hopes for global recovery in demand. Disruptions at major mines and Chinese plants which produce more than half of the world’s refined copper impact price.
February 26 – Bloomberg (Alfred Cang, Archie Hunter and Mark Burton): “The world’s top commodity traders are rushing to ship copper to the US from as far afield as Asia as Donald Trump’s threat of import tariffs on the metal creates a huge opportunity for profit. The gap between copper prices in the US and the rest of the world widened sharply after the president… ordered the Commerce Department to examine potential levies on the metal. On Wednesday, prices on New York’s Comex surged as much as 4.9% to trade more than $1,000 a ton above the London Metal Exchange benchmark, which rose 1.2% to about $9,500 a ton.”
Gold
Gold futures trade with investors safety amid growing global uncertainties. The rally was fueled by the Fed’s cautious tone on inflation and economic risks, which dampened rate hike expectations. Rising geopolitical tensions, especially U.S.-China trade frictions and steady central bank demand, particularly from countries diversifying away from the dollar, reinforced gold’s appeal as a safe-haven asset.
“Central banks are increasingly looking to bolster their gold reserves. And they are turning to mines in their backyard to source the yellow metal. Besides being cheaper, securing gold directly from mines helps support local industry and bolsters reserves without weighing on foreign exchange reserves, experts said. While countries such as the Philippines and Ecuador have been doing this for years, more central banks with access to domestic gold mines have started, increased, or are considering direct local purchases, according to the World Gold Council July 15 – CNBC (Lee Ying Shan)
“China added to its official gold reserves for an eighth straight month in June, as prices of the precious metal traded near a record high. Bullion held by the People’s Bank of China rose by 70,000 troy ounces last month… Its gold reserves have climbed by 1.1 million troy ounces — or about 34.2 tons — since the current run of purchases began in November last year.” July 7 – Bloomberg (Sybilla Gross
“A record share of the world’s central banks plans to accumulate more gold over the next 12 months, drawn by bullion’s performance during times of crisis and protection against inflation. In a survey of 72 monetary authorities, 43% said they expected their gold reserves to increase, up from 29% a year earlier and the highest figure in eight years… Central banks have been one of the most important drivers of a long-running gold rally that has seen prices double since late-2022. The pace of buying doubled after the invasion of Ukraine…” June 16 – New York Times (Jack Ryan)
“China expanded its gold reserves for a sixth straight month in April, underlining its push to boost holdings of the precious metal as prices trade near a record and the trade war rumbles on. Bullion held by the People’s Bank of China rose by about 70,000 troy ounces last month… In the latest six-month span, volumes have climbed by close to 1 million ounces, or about 30 tons.” May 7 – Bloomberg (Yihui Xie)
Shanghai Futures Exchange trading volumes of gold highest levels in a year. Investors and industry players (refineries, traders and retailers) have ramped up hedging activities as global markets gyrate in response to trade policy changes in the US and China.
Physical demand for gold has been strong this week, and in China buyers are paying a significant premium for the metal over international spot prices, a sign of strong demand.
UBS raised its gold price forecast in April for the second time this year, to $3,500 per troy ounce over the next 12 months, up from the $3,000 forecast made at the start of the year. “We expect additional demand from central banks, institutions and investors following current events,” UBS analysts wrote in a note to clients.
Gold hit record highs as inflation, safe haven, and Russia and China buying to avoid sanctions pushed it higher last year. The price rose against multiple currencies, including the U.S. dollar. The structural driver is higher demand from central banks, while a cyclical lift would come from flows to exchange-traded funds as the Federal Reserve cuts.
Silver
“Silver jumped to its highest level since 2011, as US premiums rise and the spot London market shows signs of tightness. Silver rose 1.6% to $37.59 an ounce, the most since September 2011. US silver futures climbed even higher, with September contracts hitting $38.46 an ounce.” July 11 – Bloomberg (Jack Ryan)
Platinum
Energy
“China’s thirst for oil drove global demand for decades. Now a government campaign to curb that addiction is nearing a milestone, with national consumption expected to peak by 2027, then begin to fall. Chinese officials have long worried that the U.S. and its allies could hamstring the nation’s economy by choking off its supply of foreign oil. So China has poured hundreds of billions of dollars into weaning itself off the imported stuff… ‘The energy rice bowl must be held in our own hands,’ Chinese leader Xi Jinping has said. Across China, fleets of gas-guzzling Volkswagen and Hyundai taxicabs are being replaced by electric models designed and produced locally. Last year, nearly half of passenger vehicles sold in the country were either all-electrics or plug-in hybrids, compared with 6% in 2020.” July 21 – Wall Street Journal (Brian Spegele):
Oil prices in 2024 traded in a relatively stable range given the world conflicts in energy supply related regions. Intraday Brent prices stayed within a $24/b range, between $68/b and $93/b the narrowest trading range since 2019. Adjusting for inflation, 2024 was the narrowest since 2003. A moribund world economy working against Middle East and Russian tensions. The selling has continued in 2025.
U.S. energy companies played the smart card pushing production higher familiar with the cycle of oil prices. Natural gas demand grew as did record U.S. production, we saw increased electricity consumption, driven by the AI mania.
“President Donald Trump may be teeing up the worst conditions for the oil business so far this century, outside of the 2020 pandemic shock… The International Energy Agency just slashed its forecast for oil demand growth this year by 29% from last month’s projection, to just 730,000 barrels a day. Its initial projections for 2026 continue the theme, with even lower growth of just 690,000 barrels per day. Both figures would represent a slowdown from 2024 and the 20-year average annual increase of almost 1 million barrels per day…” April 15 – Bloomberg (Liam Denning)
Oil and Iran
US Crude Oil (WTI)
Daily: WTI Crude Oil gave back all its rally that evolved from retesting the pennant breakout last December after completing the correction in 3 waves. from there it has fallen to new lows and the upside burst has effectively rinsed short and trapped new speculative buyers with the market now rinsing them as it falls to test support. The market has behaved as expected as we have said being in a completive mode for bulls with the upside impulse, it was a question of degree on the topside, as it will be on the downside. Use the Murrey math 240/60 grid. Was oil completing a C or IV? Support is previous lows and the bull flag. The bear case is the high was a complete 5.
Weekly: WTI crude oil futures held the support line from July 2021, having plunged around 50% off 2022 highs. The market is now back testing it. The break to the topside of its sphere of influence to close out the quarter over Kijun and Tenkan failed, and which are now resistance. Risk support is the grid. Resistance weekly channel, Murrey Math levels and previous breaks (off monthly). Bear case is Wave 5 complete.
What we broke……. Crude Oil in the past quarter built a huge bull flag. We watch if the recent break was false, or we fail. Very clear pattern.
The key is crowd behavior to help tell the story which in energy is often around geopolitics. A great example of why we watch ABC corrections and from here we get the energy from the break being balanced. This move that was powered by 50 dma Tenkan spit of a spit – hence the fractal energies reverberations.
Refinery closures in Europe and US expected to reduce net capacity by 75,000 barrels per day this year.
In China, the refining industry is at a “crossroads as demand approaches its peak,” with 840K b/d of capacity at risk of closing before the end of 2028, according to BMI. Most of the expected reduction in capacity is likely to come from state-owned refiners, although independent processors are also under pressure.
via BloombergNEF tracking of more than 60 assets around the globe.
Daily: US Natural Gas futures are a great example of rebalancing mania. The market is still correcting the manic 5 post the Ukraine invasion and beyond. Since the breakdown of the correction channel with failed breakups we have continued to multi year lows in a pennant formation after holding the daily 1/8. We now look at our Adam’s theory fractal rules with fractal spits powering these moves lower. Two clear alternatives, we are correcting the highs 5 or that was a 3 and we go higher. Resistance is heavy: 2/8 and cloud above. Kijun, 50 dma and cloud. Support is previous lows. Important to watch how this energy was built for shape correlation.
Like the larger wave on the way up it accelerated through previous highs (flat topped triangle energy) and over the resistance at 8/8 and new highs. We successfully tested that break in a pennant ABC. Previous highs (flat topped triangle energy) and 8/8 and new highs underscore the structure that fed the move and is key longer term in the collapse lower.
Weekly: Natural gas has been busy correcting the past months when it blew through all levels of support after breaking the weekly 50wma and the Kijun gave a kiss of death. From there we formed an island reversal which has resolved to the topside, trapping shorts and bears. Recall it broke down out of the corrective channel (Wave 4 or IV) to new multi-year lows. The instability and volatility stem from the sharp reversals that have failed indicative of speculative fervor like the previous impulsive spikes. Support is the flat Kijun and Tenkans. Resistance the near highs and previous uptrend. Bulls need all the damage down to be rebuilt. Kijun became the accelerator given energy lower and now higher came from a clean break of the Kijun
John Maynard Keynes, 1920: “There is no subtler, no surer means of overturning the existing basis of society than to debauch the currency. The process engages all the hidden forces of economic law on the side of destruction and does it in a manner which not one man in a million is able to diagnose.”
For the week ended July 18, 2025, the U.S. Dollar Index declined 0.8% to 97.645 (down 10.0% y-t-d)
On the upside, the Swedish krona increased 1.4%, the Mexican peso 1.1%, the euro 1.0%, the New Zealand dollar 0.9%, the Australian dollar 0.9%, the Japanese yen 0.9%, the Swiss franc 0.7%, the South Korean won 0.6%, the Singapore dollar 0.3%, the Brazilian real 0.3%, the Norwegian krone 0.3%, the Canadian dollar 0.2%, and the British pound 0.2%. The Chinese (onshore) renminbi increased 0.07% versus the dollar (up 1.81% y-t-d).
On the downside, the South African rand declined 0.3%.
The Dollar from Flex to Sell
“The US dollar had its worst start to the year since 1973, as Donald Trump’s trade and economic policies prompt global investors to rethink their exposure to the world’s dominant currency. The dollar index… tumbled 10.8% in the first six months of 2025, the worst start to the year since the end of the gold-backed Bretton Woods system. ‘The dollar has become the whipping boy of Trump 2.0’s erratic policies,’ said Francesco Pesole, an FX strategist at ING.” – June 30 – Financial Times (Ian Smith)
June 23 – Reuters (Yoruk Bahceli and Dhara Ranasinghe): “The custodians of trillions of dollars of global central bank reserves are eyeing a move away from the greenback into gold, the euro and China’s yuan as the splintering of world trade and geopolitical upheaval spark a rethink of financial flows. The survey of 75 central banks… gives a first snapshot of the repercussions of U.S. President Donald Trump’s April 2 Liberation Day tariffs that sparked market turmoil and a slide in the safe-haven dollar and U.S. Treasuries. Gold, which central banks have already been adding at a record pace, was seen benefiting even further longer term, with a net 40% of central banks planning to increase gold holdings over the next decade. ‘After years of record-high central bank gold purchases, reserve managers are doubling down on the precious metal,’ OMFIF said.”
May 20 – Reuters (Saqib Iqbal Ahmed and Laura Matthews) “Trade-related uncertainties, ballooning fiscal debt and weakened confidence about enduring U.S. exceptionalism have weighed on U.S. assets, with the dollar one casualty. Investors see the currency losing more of its luster as the greenback comes back to earth from lofty valuations. The Trump administration’s tariffs salvo this year prompted investors to cut exposure to U.S. assets after a long period of overperformance… ‘There’s plenty of room for further depreciation, purely from a valuation perspective,’ said George Vessey, lead FX and macro strategist at payments firm Convera. The ‘sell America’ trade was back in focus after Moody’s U.S. credit downgrade, he said.”
Where is all this liquidity coming from fueling this one asks. Well simple really and a reminder of why we watch the carry trade so intently. With greed overshadowing risk and again why breakeven or break up tests are so important, again look at our notes on the stock indices, bitcoin and forex, even gold. The index of carry returns hit a seven-year high in late May Bloomerg reported. Asset managers boosted long positions in developing-nation currencies in recent weeks, our ols favorite Mexico peso reaching a nine-month high. Other, riskier EM carry trades have been the Chilean peso and South Korean won in this run.
The move has coincided with the collapse of the VIX, the strategy performs best in periods of low volatility. JPMorgan Chase’ ‘s gauge of global currency volatility dropped to 8.7% on Friday from as high as 11% in early April. Recall the swoon last year in August with most carry trades funded in the ultra-low-yielding yen being wrecked after the Bank of Japan interest-rate hike that triggered a surge in the yen and with-it losses on the currency, forwards spreads. This was well telegraphed and a reminder to be proactive not reactive and note when scenarios have run their course risk wise. Expect the unexpected.
Another big fillip was NVIDIA’s (NVDA) better-than-expected earnings report and outlook after Wednesday’s close. It should be noted that in a somewhat amazing mis report from NVDA where it was initially reported as a miss at .81 EPS and then corrected to .96 EPS, after there was heavy selling and causing shorts to cover and rebuy added to the strength, Intentional, doubtful but the price affect real. You could argue the same on the tariff on and off effect on trade. Squeeze the shorts, buy the dips like with intent. There was more sources of strength came from stronger 2-yr, 5-yr, and 7-yr note Treasury auctions, improved consumer confidence, and some confusing action on the tariff/trade front.
Talking about tariff on and off market affects; on Wednesday, the U.S. Court of International Trade ruled that the president did not have the legal authority to enforce reciprocal tariffs. On Thursday, the U.S. Court of Appeals granted the White House’s request to temporarily reinstate the tariffs. On Friday, President Trump said China had violated the preliminary trade agreement worked out in Switzerland and noted “So much for being MR. NICE GUY!” before adding later that day that he hopes to be able to work things out with President Xi.
The carry trade in less liquid currency brings risk, as alpha strategy do, currency risk is real. Remeber all the punters that bought the Turkish Lira? The Taiwan dollar surged early May as currency gains saw a stampede to exit positions using it as a funding currency. The Hong Kong dollar back tested the weak end of its trading band in late May as falling local interest rates helped traders to use the currency as a funding vehicle Bloomberg reported. The trade war and the PBOC talking of more easing monetary-policy further in China is seeing the yuan becoming an attractive funding currency,
With inflation falling back with growth falling after high interest rates in many emerging-market economies real yields on their bonds are relatively attractive. Don’t forget the currency risk, see above! Brazil’s real features is being pushed by as an attractive longs at investment banks such as Goldman Sachs Group and ING Groep NV. Something to remeber the BRL fell to record lows earlier in the year against the US dollar and recovered from record support from Brazil’s central bank.
Extraordinary late-cycle resilience is only fitting of history’s greatest Bubble. Explanations include Credit system might that comes from steadfast $2 TN or so of annual federal debt growth – the reckless expansion of money-like Treasury debt. What’s more, Trillions of Treasury/Agency market speculative leverage create a hardier market structure than, say, levered positions in more suspect corporate debt or risky mortgages. And it’s worth noting the recent comments of the robustness of private Credit and private markets more generally.
Key Currencies Versus the US Dollar
Australian Dollar – AUDUSD
The Australian dollar has recovered back to last year’s breakdown. It has corrected off a 5 year low in the New Year after it continued lower after breaking a three-month low of US65.1¢ on news of a Donald Trump’s US election victory before rebounding to US66.51¢ on hopes of fresh China stimulus.
The Aussie dollar had been correcting since completing a 5 at the psych 80 level to fall under the weekly cloud in emotive fashion. The Australian dollar fell to test of the August lows of 0.7106 with Omicron fears. When that double bottom support broke it retested the Murrey Math Levels. Resistance the Cloud, Tenkan and Kijun like many commodities. From there it has been a combination of a stronger US dollar, a collapsing Chinese economy & concerns over the US economy.
Japanese Yen – USDJPY
USDJPY is consolidating the break after weakness with Treasury yields to rush to +2/8 and channel convergence. It came a long way from that 108.00 massive support for dollar-yen back through the top of the flat-topped triangle at 151/152 whcih it spins around in 2025. Any change will come from the weekly Kijun. Use your USDJPY Murrey 7/8 8/8 grid for now. EURJPY AUDJPY will determine risk on/off.
Yen weakness provided key support to dollar melt-up dynamics with BOJ slow-motion “normalization” in a world of fast-moving dynamics. The dollar yen traded 160.17 this cycle, the first time above 160 since April 1990. Governor Kazuo Ueda on that move basically ceded the yen fragility issue to the Ministry of Finance (MOF), affirming it wasn’t in the BOJ’s purview. He conveyed little concern for yen weakness, while downplaying its inflationary impact. The market accordingly took the yen out to the woodshed.
Hong Kong Dollar – USDHKD
June 25 – Financial Times (William Sandlund): “Hong Kong’s de facto central bank has intervened again in foreign exchange markets to defend the city’s currency peg, in a move that threatens one of the world’s most attractive carry trades. The Hong Kong Monetary Authority said it used HK$9.4bn ($1.2bn) of its reserves to buy Hong Kong dollars on the open market… The move will drain liquidity from the banking system and pushed up interbank lending rates on Thursday, potentially threatening a carry trade that has allowed investors to borrow cheaply in the city’s currency before investing in higher-yielding US debt securities.”
Chinese Yuan – USDCNH
China has been battling a weak economy for years and has been flooding its economy with liquidity to no avail, the result, falling yields and a record low for the Yuan against the US dollar. So far it has been defended at a triple top.
“People’s Bank of China Governor Pan Gongsheng laid out in the clearest terms yet his vision for the future of a new global currency order after decades of dollar dominance, predicting a more competitive system will take root in the years to come. ‘In the future, the global monetary system could continue to evolve toward a situation where a few sovereign currencies co-exist, compete and check and balance each other,’ Pan said… Pan said there have been discussions around the world on how to reduce excessive reliance on a single currency, adding that the yuan’s global status has risen in recent years. Confidence in the US is waning after months of President Donald Trump’s erratic policymaking.” June 17 – Bloomberg
“Doubts over US exceptionalism are giving China a much needed break from strongly defending its currency, as the yuan’s strength allows it to dial back support via its daily reference rate. The gap between the People’s Bank of China’s daily reference rate versus narrowed to 675 pips on Monday, the least since early December. While the so-called fixing remains near the strongest level since November, its smaller spread with estimates signals weakening official support for the currency.” March 10 – Bloomberg (Iris Ouyang)
To begin 2025 the onshore yuan weakened past the level that China had been defending throughout December. The yuan breached the psychological milestone of 7.3 per dollar for the first time since late 2023, amid concerns over China’s economic struggles and a widening bond yield discount to the US. The move came even as the central bank maintained its support for the currency with its daily reference rate that Friday.
February 26 – Reuters: “Chinese authorities are rolling out fresh measures to limit capital flight, including increased scrutiny of overseas investments, as the yuan currency comes under mounting pressure. President Donald Trump’s tariffs threats are heightening Sino-U.S. tensions and discouraging inbound foreign investment… China has increased scrutiny of overseas investments by domestic companies and their use of proceeds from Hong Kong share sales… Meanwhile, China’s commercial banks sold the most foreign exchange to their clients since July last month… The conversion ratio – a gauge that measures households and corporates’ willingness to sell dollars for yuan – fell to the lowest level in seven months. Xinquan Chen, an economist at Goldman Sachs, said the current account showed sizeable currency outflows in January.”
January 12 – Bloomberg: “China has ramped up its support for the yuan with tweaks to its capital controls and a vow to crack down on market disruption, after the currency dropped close to a record low against the dollar in offshore trading. The People’s Bank of China and other regulators pledged to strengthen their management of the foreign-exchange market, deal with any behavior that may disrupt the market and prevent the risk of a large move in the yuan… The PBOC also adjusted its rules for cross-border flows…, allowing firms and financial institutions to borrow more from overseas, which may help increase capital inflows and support the yuan.”
South Korean Won – USDKRW
The won has slightly appreciated so far this year after tumbling since October 2024 by a cumulative 12% depreciation to the dollar both on domestic political developments and external concerns related to a less dovish Federal Reserve and trade policy risks. It had dropped to its weakest level in 15 years.
The Americas
The Canadian dollar and Mexican dollar weakened and retraced some since the mention of Trump tariffs on the two countries.
Canadian Dollar – USDCAD
The Loonie has been in a steady downtrend since 2021, on yield pressures, weakening economic metrics and political uncertainty. The USDCAD hit a 3 year high in June and corrected that in 3 waves led by the AUD and NZD with oil price impacting direction from there the selling of the Loonie resumed. From there it broke the 2020 highs and tested 1.48 before reverting back on tariff gamesmanships in 2025.
Mexico Peso – USDMXN
Mexico’s currency is part of a carry trade that involves investors borrowing in currencies that have low interest rates, such as the Japanese yen or Swiss franc, and buying higher yielding ones such as the Mexican peso or, recently, the U.S. dollar. It has boomed in popularity as interest rates have diverged around the world and market volatility has stayed low. after the Mexican election this year the peso had a dramatic fall against the yen – it dropped 4.4% on that Monday in its biggest daily decline since the COVID-19 crisis.
The peso had climbed to the strongest in almost nine years driven by relatively high local interest rates and low currency volatility until, that sell off.
Brazilian Real – USDBRL
December 19 – Bloomberg (Martha Beck, Vinícius Andrade, Maria Eloisa Capurro and Leda Alvim): “As the currency craters in Brazil, thrusting the country’s markets into the international spotlight for the first time in years, a grim reality is setting in for top economic aides to President Luiz Inacio Lula da Silva. They are, they fear, powerless to do much to stop the panic… The central bank has ramped up intervention in currency markets to try to stem the losses amid what Governor Roberto Campos Neto called an ‘atypical’ outflow. It has stepped in either directly or through swaps almost every day for the past week, spending close to $14 billion to give some support to the real… On Thursday alone it sold $8 billion in back-to-back spot auctions — that’s the biggest daily sale of dollars since at least 1999, when Brazil adopted a floating exchange rate regime…”
Europe
Euro – EURUSD
Euro continued to bump up against that downtrend line from 2020 and spinning around the 50% of that year’s panic sell. The euro trades in what seems like eternal flags in the channel. We watch if Kijun (pink) testing Tenkan (orange) creates any impulse as EURUSD consolidates under the cloud and break up level from 2022. Watch 3 waves to see development for continuation and for impulse off Chikou rebalance. Governed by EURGBP and Bund volatility.
British Pound – GBPUSD
British pound rose in a classic rising wedge since its late 2022 spike classic retest until its daily break late 2024 which brought a weekly kiss of death. From there a weekly cloud break with magnet pulls of cloud twist after ABC correction – will need Tenkan to break through Kijun for more strength. The upcoming months will be heavy on UK data and EU, Ukraine speculation which could mean an eventful time for the British pound.
Swiss Franc USDCHF
Turkey Lire USDTRY
Political instability erupted in Turkey at the hand of its autocratic and antidemocratic president on March 19. The Turkish lira immediately collapsed 12%, though record ($9bn) intervention reduced the day’s loss to 3.2%. Turkey’s central bank boosted short-term rates two percentage points to 46%. Yet the lira’s 3.1% loss was the largest weekly decline in almost two years. Turkish stocks were slammed 16.6%, with “banking stocks experiencing their worst weekly drop since at least 2001” (Bloomberg). Turkey’s local currency bond yield spiked 293 bps to 29.16%. “Turkish Lira Rout Sours Lucrative Carry Trade.” “Turkey’s Erdogan Warns Opposition Over Calls for Mass Protests.”
March 28 – Bloomberg (Ugur Yilmaz): “Ekrem Imamoglu, the Turkish opposition figure whose detention this month triggered mass protests and a market selloff, criticized Western leaders for their muted response to his arrest. In a piece published in The New York Times…, President Recep Tayyip Erdogan’s main political rival accused the US and Europe of prioritizing geopolitical interests over democratic values. ‘Their silence is deafening,’ Imamoglu wrote of world governments. ‘Washington merely expressed ‘concerns regarding recent arrests and protests’ in Turkey. With few exceptions, European leaders have failed to offer a strong response.’”
Cryptocurrenices
Bitcoin
Bitcoin is the world’s biggest digital asset; it had already staged a remarkable comeback in 2023. Then in January the approval of US Bitcoin exchange-traded funds was a further catalyst for gains. Donald Trump’s victory in November turbocharged BTC, sparking a record-breaking rally over the $100,000 level. Along the way, traders poured more than $100 billion into the ETFs, paving the way for similar crypto-related investment vehicles. At the opposite extreme, activity in memecoins, which often trade for a fraction of a cent, exploded.
Trump galvanized the digital-asset community with promises to reverse a US crypto crackdown under President Joe Biden and make America the center of the industry. In the weeks after the election, he announced the newly created post of czar for AI and crypto, and named industry proponent Paul Atkins to replace crypto nemesis Gary Gensler at the Securities and Exchange Commission.
This year also set a record for US ETF fund flows, with Trump’s presidential victory giving already emboldened investors even more incentive to double down. Funds that track the S&P 500 took the most flows, one of this year’s most notable new entrants was BlackRock’s Bitcoin ETF drawing the third-most inflows this year.
Bitcoin is performing technically to perfection. Impulse begets impulse. To understand panic, understand greed. Bitcoin exploded higher following its correction impulsively upon completing 5 waves up at +2/8. Each Tenkan and Kijun tap saw an explosive kiss of death until we completed 3 waves to around 28,000. From there we have seen extreme volatility to a new record high and retest.
We have seen what you would expect from a 5-wave impulse peak and ABC correction, a violent correction and completion. Use Murrey Math levels for corrections and targets as algorithms control the herd here, support is the cloud and sharp ABC, 1-2 moves. From there prices agitated towards those ATHs as news of a Bitcoin ETF fueled the rally, sound familiar? But this time it wasn’t signaling we are in a 3 high probability but a 5.
Solana
Ethereum
On the Risk Radar
Geopolitical Tinderbox Radar
The Week Ahead – Have a Trading Plan
WatchEarnings, Central Bankers and Geopolitics speeches, reportsandrate moves.
Next Week’s Risk Dashboard
Global Week Ahead Highlights
Tariff cliff week
The deals to date, the deadlines to come
Tariffs + rebates + capital gains relief ≠ Fed cuts
The debate over market reactions to trade deals
FOMC will remain patient
Bank of Canada to stand pat
Nonfarm payrolls preview—one of many before next decision
Fed’s preferred inflation gauge to show moderate inflation
BoJ likely to hold, hawkish bias in question
Canada’s economy flat in Q2, exiting stronger
US Q2 GDP likely to remain resilient in
ISM to be littered with tariff references
Mexico’s Q2 GDP to test tariff effects
BCCh may have a long way to go yet
BanRep’s split likely to favour a cut this time
Brazil’s Selic rate to be unchanged
SARB said they’d cut
Eurozone GDP still resilient?
Eurozone inflation still on target?
China PMIs to refresh growth risks
Australian CPI to tee up the RBA’s August decision
US Economic Highlights
Monday: $69 bln 2-yr Treasury note auction results at 11:30 ET and $70 bln 5-yr Treasury note auction results at 13:00 ET
Tuesday: June advance International Trade in Goods (prior -$96.6 bln), advance Retail Inventories (prior 0.3%), and advance Wholesale Inventories (prior -0.3%) at 8:30 ET; May FHFA Housing Price Index (consensus -0.2%; prior -0.4%) and May S&P Case-Shiller Home Price Index (consensus 3.0%; prior 3.4%) at 9:00 ET; July Consumer Confidence (consensus 95.5; prior 93.0) at 10:00 ET; and $44 bln 7-yr Treasury note auction results at 13:00 ET
Wednesday: Weekly MBA Mortgage Index (prior 0.8%) at 7:00 ET; July ADP Employment Change (consensus 78,000; prior -33,000) at 8:15 ET; advance Q2 GDP (consensus 2.5%; prior -0.5%) and advance Q2 GDP Deflator (consensus 2.6%; prior 3.8%) at 8:30 ET; June Pending Home Sales (consensus 0.4%; prior 1.8%) at 10:00 ET; weekly crude oil inventories (prior -3.17 mln) at 10:30 ET; and July FOMC Rate Decision Minutes (consensus 4.25-4.50%; prior 4.25-4.50%) at 14:00 ET
Thursday: June Personal Income (consensus 0.3%; prior -0.4%), Personal Spending (consensus 0.4%; prior -0.1%), PCE Prices (consensus 0.3%; prior 0.1%), core PCE Prices (consensus 0.3%; prior 0.2%), Q2 Employment Cost Index (consensus 0.8%; prior 0.9%), weekly Initial Claims (consensus 220,000; prior 217,000), and Continuing Claims (prior 1.955 mln) at 8:30 ET; July Chicago PMI (consensus 42.1; prior 40.4) at 9:45 ET; and weekly natural gas inventories (prior +23 bcf) at 10:30 ET
Friday: July Nonfarm Payrolls (consensus 102,000; prior 147,000), Nonfarm Private Payrolls (consensus 110,000; prior 74,000), Unemployment Rate (consensus 4.2%; prior 4.1%), Average Hourly Earnings (consensus 0.3%; prior 0.2%), and Average Workweek (consensus 34.2; prior 34.2) at 8:30 ET; June Construction Spending (consensus 0.1%; prior -0.3%), July ISM Manufacturing Index (consensus 49.5%; prior 49.0%), and final July University of Michigan Consumer Sentiment (consensus 61.8; prior 61.8) at 10:00 ET
Bond Market Highlights
Monday: 3-, 26-week bills; 14-day cash management bills, $69 bln 2-yr Treasury note auction results at 11:30 ET and $70 bln 5-yr Treasury note auction results at 13:00 ET
Tuesday: 6-week bills; $44 bln 7-yr Treasury note auction results at 13:00 ET
Wednesday: 17-week bills;
Thursday: 4-, 8-week bills;
Central Bank Highlights
Updated July 25, 2025
CENTRAL BANKS—DM INACTION
A bevy of central banks will weigh in during the final days of July before what is classically a relatively quiet month of August for their decisions and communications. An exception is the Federal Reserve’s annual Jackson Hole Symposium on August 21st-23rd. The biggest central banks (Fed, BoJ, BoC) are not expected to alter their policies, but key may be any guidance. Brazil is also expected to hold, but central banks in Chile, Colombia and South Africa are likely to cut.
Bank of Canada—Still Fighting the Last Fight
The Bank of Canada delivers a full set of communications including its latest rate decision on Wednesday. The statement arrives at 9:45amET along with the fresh Monetary Policy Report and followed by the press conference 45 minutes later. Any local market effects might soon be overwhelmed by the FOMC communications that same afternoon.
No policy rate change is expected at this meeting. Markets have no move priced. At the time of writing, the freshest estimates within consensus expect a hold but there remain several stale entries. Risk of a cut rests upon the BoC’s willingness to surprise (chart 17) but would be difficult to explain with a credible narrative.
I wouldn’t be surprised to see the BoC continue to boycott the forecasting business by holding off on the production of a base case projection in favour of scenarios as it did in the last MPR in April. If it does produce a base case projection, then they would have to explain what gives them confidence to do so.
One reason for holding the line is that core inflation remains too hot (here). The BoC’s two preferred gauges of underlying inflation—trimmed mean CPI and weighted median CPI— have been tracking far above the 2% headline inflation target for a long time now which indicates that the BoC has not beaten back the drivers of inflation risk (chart 18, 19). That chart also shows a similar picture for traditional core CPI. Inflation breadth has also been rising over recent months (chart 20).
Sticky underlying core inflation at such high rates is persisting despite the emergence of a modest amount of slack beginning in either 2023Q3 or 2024Q1 depending upon which one of the BoC’s two output gap measures are used. Elevated core inflation 8–10 quarters are slack began emerging may indicate the lags between the emergence of slack and lower inflation take longer today, or that the estimates of slack are too small to have a meaningful impact, or that other forces beyond output gaps are driving inflation. Persistently elevated inflation expectations could be one driver that is feeding a self-perpetuating cycle of elevated actual inflation after the shocks of the pandemic. The effects of trade wars on supply chains may remain at a nascent stage of forcing companies to preserve higher than normal inventories, build them further, and bring chains closer and tighter together away from production markets with higher border risks. All of that means higher costs, borne by consumers and other businesses. The lagging effects of C$ depreciation over recent years may be another incremental factor. So might competition and concentration in some sectors that have pricing power.
Second, the job market remains strong. 83,000 jobs were created in June with decent details. Year-to-date job growth of 144k remains solid and probably understated since the January to April period used seasonal adjustment factors that were among the lowest on record comparing like months in history.
Third, the federal government is working toward a major budget in early fall. The BoC would be well advised to wait and see the contents and evaluate the implications for medium-term growth so it doesn’t repeat the mistake of combining excessive monetary and fiscal stimulus.
Fourth, there is high uncertainty surrounding US trade policy developments and Canada’s response. The BoC may wish to wait until it sees clearer evidence. This meeting coincides with the deadline two days later of the postponed tariff hit to Canada. Even if an agreement arises—which appears highly unlikely based on remarks from PM Carney—it seems unlikely that the BoC will have enough details to be confident in the durability, depth and certainty it offers.
Most of the tariff shock that is likely to hit Canada is sector-specific especially on metals. Monetary policy can’t do anything about that as opposed to fiscal and regulatory supports and transition programs. The rest of the economy faces a light tariff hit.
Fifth, while Q2 GDP growth is likely to be soft as noted in the section on the topic in this report, the BoC might look through it as the flip side of the solid 2.2% growth in Q1 with both quarters distorted by tariff front-running effects on order books and trade. They may wish to wait to evaluate data over the second half of this year.
Sixth, the policy rate is already at 2.75% which rests within the BoC’s estimated neutral rate range of 2.25–3.25%. That connotes balanced policy optionality around multiple scenarios as opposed to a perhaps greater case to adjust policy if it were far above neutral.
Seventh, the evidence may suggest that the BoC cut too far too quickly. The BoC ended quantitative tightening earlier than other central banks. The BoC began cutting in May of last year and has cut by 225bps to date—absent concrete evidence that its data dependent mantra was ticking the box on contained inflationary pressures to date.
In all, how can you adjust policy when you haven’t a clue what trade and fiscal policies might unfold and you are still fighting the last inflation fight alongside resilient data like job growth? That merits keeping their powder dry with data to date not indicating any great reason to rush a decision other than on a total policy lark.
Federal Reserve—Performative Theatre
Despite the theatrics, another FOMC decision should come and go like a summer breeze. The real debate begins in earnest when the kiddies go back to school. September’s decision beckons after more data and maybe some clarity around the administration’s policies on trade. At this point, forecasting a cut for September is done in the same lark that motivated markets to keep pushing out easing bets throughout the year.
Wednesday’s statement (2pmET) will be followed by Chair Powell’s press conference (2:30pmET). There will be no projections or dot plot with this one since that was provided at the last meeting.
Markets are priced for no change at this meeting. They remain stuck in the year-long serial pattern of pushing out rate cut bets after getting successive meetings wrong.
Dissenting votes are possible with the most likely ones being Governor Waller and/or Governor Bowman in that order of likelihood.
Two key issues will keep the FOMC on hold. One is that the Fed is data dependent and recent data has not supported easier monetary policy up to this point. We’ll get Q2 GDP growth just hours before the Fed on Wednesday and it is expected to remain resilient. Core CPI accelerated in June on a m/m SAAR basis (here) and there were nascent signs of tariff pass through into select categories (chart 21). Soft data like the ISM price gauges serve as a leading indicator of inflation and are rising sharply as covered later in this note. Nonfarm payrolls have remained resilient including June’s 147k rise and the prior month’s 144k gain which is likely ample job growth given that the so-called breakeven rate of job growth that maintains a reasonably stable unemployment rate has moved lower in light of tighter immigration policy and the effects on weaker growth in the labour force.
As an offshoot of this, it’s clearly inconsistent for President Trump and House Speaker Johnson to keep saying that the US has the greatest and strongest and best performing economy on the planet, while nevertheless demanding several percentage points of rate cuts.
Second is that the debate over how trade, fiscal, immigration and regulatory policies may affect the Fed’s dual mandate going forward in future date remains open. The nature of these shocks creates a potential quandary for the Fed in that, for instance, protectionist policies may raise unemployment and inflation simultaneously. Easier monetary policy may be appropriate if growth and the job market sag, but not necessarily if inflation surges. The balance between the two effects and how durable the effects may be will determine appropriate policy actions. Until we have the data over an extended period it may not be advisable to alter course.
That pivots toward the September 17th FOMC meeting and subsequent ones. Multiple rounds of inflation and job market data may be required alongside greater policy clarity and more consistency from the Trump administration. Should tariff pass-through into inflation increase over coming months, then the optics of easing in that environment may be too much to allow the Fed to ease unless payrolls begin falling.
Bank of Japan—Tread Carefully
The Bank of Japan delivers its latest policy decisions with updated projections on Thursday. Markets are priced for no move and consensus unanimously expects no change to the 0.5% target rate. Markets only begin to raise pricing for another rate hike by the October and December meetings and even at that fall shy of full cut pricing.
Key will be the forecasts and Governor Ueda’s guidance. Ueda may continue to generally guide openness toward eventual further policy tightening. Whether he should or not is another matter.
One issue is whether past forces that contributed toward raising inflation that justified tightening will persist or not. The fresh Tokyo measure of core CPI inflation for July was weak again. July’s reading was flat at 0% m/m SA and followed a reading of only 0.1% m/m SA in June (chart 22). Is the surge over? Was it temporarily fed by prior peaks in oil prices in 2023–24 plus peak weakness of the yen in 2024? Are Shunto wage gains not really filtering through to more of the workforce than the under 20% of workers who benefit from the union agreements? Perhaps, but the BoJ will need more evidence than two reports as it refreshes forecasts and guidance at next week’s decision when it is expected to remain on hold.
A second issue is how the BoJ views the recent trade ‘deal’ with the US. It certainly won’t criticize the government’s deal, but will it sound more upbeat on reduced uncertainty or still cautious and circumspect? You could argue both ways. The deal lowers the threatened tariff on Japanese exports to the US from 25% — which was set to take effect on August 1st — to 15%. Additionally, tariffs on Japanese auto and auto parts exports, which represent a significant share of Japan’s total exports to the US, will also be reduced from 27.5% to 15%. In exchange, Japan offered to invest about half a trillion in the US. And yet, as Japan’s negotiator Akazawa put it, there is presently no move toward a legally binding agreement with enforcement and tracking provisions or agreement on implementation.
Third, political uncertainty is hanging in the air. After losing both the lower house election last October and the upper house election this month, PM Ishiba is walking a fine balance in terms of support within his weakened coalition. That could carry implications for other policy arenas, like fiscal policy and immigration particularly as an anti-immigration far right party ascends.
Central Bank of Brazil—A New Wrench
Banco Central do Brasil is widely expected to maintain its Selic rate at 15% on Wednesday.
Inflation remains elevated (chart 23) and so do inflation expectations (chart 24). The central bank may think that the resumption of a tightening cycle that began last September and took the Selic rate up by 450bps to 15%—its highest since 2006—needs to be given more time to work through the economy and bring inflation lower.
The new wrench in the works is Trump’s politically motivated threat to impose a 50% tariff on Brazilian exports to the US unless the Lula administration ceases its prosecutor efforts of former President Bolsonaro who is accused of playing a role in a coup attempt aimed at invalidating the election results when he lost.
Brazil has threatened to retaliate if Trump proceeds this Friday. The net impact of bilateral tariffs on growth and inflation depends upon the course of events on this matter which may mean forward guidance could be rather reserved.
BCCh—Quite a Way to Go
Banco Central de Chile is widely expected to resume easing by cutting its overnight rate by 25bps to 4.75% on Tuesday.
Why? At its June meeting, the bank noted that “If the central scenario of the June IPoM [ed. Monetary Policy Report] materializes, in the following quarters the MPR [ed. Monetary Policy Rate] will be approaching its range of neutral values”, which ranges between 3.5% to 4.5%. At 4.75%, the central bank has a way to go before approaching the midpoint. Softening inflation and growth readings offer additional cover for easing at this meeting and so does the threat of US copper tariffs.
BanRep—Split No Longer?
Banco de la Republica de Colombia (BanRep) is widely, but not unanimously, expected to cut its overnight lending rate by 25bps to 9% on Thursday.
There was already somewhat of a bias toward easing among some members at the last meeting on June 27th when the bank held but with a split vote somewhat in favour of easing. Downside risks to growth stemming from US trade policy, softer but not soft recent core inflation (4.9% y/y), lower but not low inflation expectations (chart 25), and a significantly restrictive policy stance are likely to be conveyed as justification for easing but with a careful forward bias.
SARB—They Said So!
The South African Reserve Bank is widely—but not unanimously—expected to cut its policy rate by 25bps to 7% on Thursday. SARB would pick up where it left off the last time it cut back in January in a step that took the rate down by 100bps starting last September.
Previously provided forward guidance noted that “rates move steadily lower in the scenario as inflation comes down”. Inflation is currently at the lower end of the 3–6% inflation target range. Trade frictions with the US and trade frictions across the global economy weigh upon the nation’s export exposures.
Commentary via Scotiabank
US Earnings Highlights
Four “Magnificent Seven” names: Apple (AAPL), Microsoft (MSFT), Amazon (AMZN), and Meta Platforms (META) with markets watching closely for updates on AI strategy, consumer trends, and cloud performance.
Other key tech names include Qualcomm (QCOM), Cloudflare NET), and Comcast (CMCSA)
In energy and industrials, Exxon Mobil (XOM), Chevron (CVX), Ford (F), Boeing (BA), and Waste Management (WM) with insights into global demand and supply chain resilience.
Key financial and fintech names including Visa (V), Mastercard (MA), PayPal (PYPL), SoFi (SOFI), Coinbase (COIN), Prudential (PRU), and Ares Capital (ARCC), along with real estate and REITs such as W. P. Carey (WPC), American Tower (AMT), and VICI Properties (VICI).
Healthcare with AbbVie (ABBV), Merck (MRK), Pfizer (PFE), UnitedHealth Group (UNH), Bristol-Myers Squibb (BMY), CVS Health (CVS), Moderna (MRNA), Teladoc (TDOC), AstraZeneca (AZN), Biogen (BIIB), GSK (GSK), Teva Pharmaceuticals (TEVA), and Regeneron (REGN)
Monday: Tilray Brands (TLRY) Enterprise Products Partners L.P. (EPD), Waste Management (NYSE:WM), Rithm Capital (RITM), Nucor (NUE), Welltower (WELL), Two Harbors Investment (TWO), Exelixis (EXEL), NOV (NOV), NewtekOne (NEWT), Cadence Design Systems (CDNS), Whirlpool (WHR), New Gold (NGD).
Tuesday: Boeing (BA) PayPal (NASDAQ:PYPL), Visa (NYSE:V), Starbucks (SBUX), Procter & Gamble (PG), Merck & Co. (MRK), Teladoc Health (TDOC), UnitedHealth Group (UNH), W. P. Carey (WPC), United Parcel Service (UPS), SoFi (NASDAQ:SOFI), Ares Capital (ARCC), American Tower (AMT), Corning (GLW), AstraZeneca (AZN), STAG Industrial (STAG), Spotify Technology (SPOT), Marathon Digital Holdings (MARA), Carrier Global (CARR), Booking Holdings (BKNG), Qorvo (QRVO), Royal Caribbean Cruises (RCL), Electronic Arts (EA), Seagate Technology (STX), Mondelez International (MDLZ), JetBlue Airways (JBLU)
Wednesday: Microsoft (MSFT) Meta Platforms (META) Ford Motor Company (F), QUALCOMM (NASDAQ:QCOM), Altria Group (MO), Kraft Heinz Company (KHC), Teva Pharmaceutical Industries (TEVA), Etsy (ETSY), Prudential Financial (PRU), GlaxoSmithKline (GSK), Lam Research (LRCX), Western Digital (WDC), eBay (EBAY), Albemarle (ALB), Agnico-Eagle Mines (AEM), Fiverr International (FVRR), Bausch Health Companies (BHC), Amarin Corporation (AMRN), VICI Properties (VICI), Ventas (VTR), MGM Resorts International (MGM), EPR Properties (EPR), Automatic Data Processing (ADP), Kinross Gold (KGC), American Electric Power Company (AEP), Arm Holdings (ARM),
Friday: Chevron (CVX), ExxonMobil (XOM) Enbridge (ENB), Dominion Energy (D), Regeneron Pharmaceuticals (REGN), Kimberly-Clark (KMB), Colgate-Palmolive (CL), T. Rowe Price Group (TROW), Brookfield Renewable Partners (BEP), Ocugen (OCGN), LyondellBasell Industries (LYB), Fulgent Genetics (FLGT), Magna International (MGA), Linde (LIN), Newell Brands (NWL),
US IPO Highlights
Week Ahead
Three notable issuers are scheduled to list in the week ahead, led by software unicorn Figma (FIG).
Figma plans to raise $979 million at a $15.9 billion market cap. Originally a browser-based tool for designing user interfaces, Figma now offers eight products, including four that were launched in 2025. The company has delivered strong growth, and it has a sticky customer base, over three-quarters of which use multiple Figma products. The market for design tools is competitive and rapidly evolving, though, and further complicated by increased use of AI.
Medtech Shoulder Innovations (SI) plans to raise $100 million at a $432 million market cap. Shoulder Innovations is a commercial-stage medical technology company that currently offers advanced implant systems for shoulder arthroplasty. Its “ecosystem” is comprised of these systems, as well as enabling technologies, efficient instrument systems, specialized support, and surgeon-to-surgeon collaboration. The company will have to spend heavily on sales and marketing to maintain its growth.
Ambiq Micro (AMBQ) plans to raise $80 million at a $435 million market cap. The company provides ultra-low power semiconductor solutions designed to address the significant power consumption challenges of general purpose and AI compute, especially at the edge. Ambiq shipped more than 42 million units in 2024, and it estimates that over 40% of them ran AI algorithms.
Stablecoin issuer Circle Internet Group (CRCL)(83.23, +52.23, +168.5%) had a wildly successful debut June 5, 2025. After pricing its IPO at $31.00 per share, the global fintech specializing in stablecoins traded as high as $103.75 before closing the session at 83.23. Circle’s US dollar-denominated payment stablecoin USDC is the #2 ranking stablecoin, holding nearly one-third of the market. The company is poised to benefit from tailwinds in the crypto space, as well as pending legislation that will provide regulatory clarity. It will likely be hurt by declining interest rates in the US, and high distribution costs weigh on margins.
Source: Renaissance Capital
Focus on yourself and what YOU CAN INFLUENCE, set your trading plan and goals in be set for 2025.
We use cookies on our website to give you the most relevant experience by remembering your preferences and repeat visits. By clicking “Accept All”, you consent to the use of ALL the cookies. However, you may visit "Cookie Settings" to provide a controlled consent.
This website uses cookies to improve your experience while you navigate through the website. Out of these, the cookies that are categorized as necessary are stored on your browser as they are essential for the working of basic functionalities of the website. We also use third-party cookies that help us analyze and understand how you use this website. These cookies will be stored in your browser only with your consent. You also have the option to opt-out of these cookies. But opting out of some of these cookies may affect your browsing experience.
Necessary cookies are absolutely essential for the website to function properly. These cookies ensure basic functionalities and security features of the website, anonymously.
Cookie
Duration
Description
cookielawinfo-checkbox-analytics
11 months
This cookie is set by GDPR Cookie Consent plugin. The cookie is used to store the user consent for the cookies in the category "Analytics".
cookielawinfo-checkbox-functional
11 months
The cookie is set by GDPR cookie consent to record the user consent for the cookies in the category "Functional".
cookielawinfo-checkbox-necessary
11 months
This cookie is set by GDPR Cookie Consent plugin. The cookies is used to store the user consent for the cookies in the category "Necessary".
cookielawinfo-checkbox-others
11 months
This cookie is set by GDPR Cookie Consent plugin. The cookie is used to store the user consent for the cookies in the category "Other.
cookielawinfo-checkbox-performance
11 months
This cookie is set by GDPR Cookie Consent plugin. The cookie is used to store the user consent for the cookies in the category "Performance".
viewed_cookie_policy
11 months
The cookie is set by the GDPR Cookie Consent plugin and is used to store whether or not user has consented to the use of cookies. It does not store any personal data.
Functional cookies help to perform certain functionalities like sharing the content of the website on social media platforms, collect feedbacks, and other third-party features.
Performance cookies are used to understand and analyze the key performance indexes of the website which helps in delivering a better user experience for the visitors.
Analytical cookies are used to understand how visitors interact with the website. These cookies help provide information on metrics the number of visitors, bounce rate, traffic source, etc.
Advertisement cookies are used to provide visitors with relevant ads and marketing campaigns. These cookies track visitors across websites and collect information to provide customized ads.